
Page 273 - IJB-10-1
P. 273
International Journal of Bioprinting Permeability of NiTi gyroid scaffolds
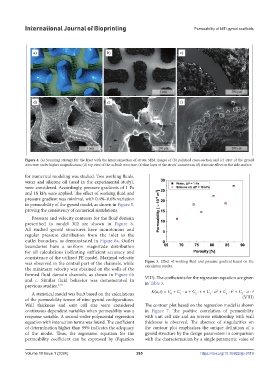
Figure 4. (a) Scanning strategy for the layer with the interconnection of struts; SEM images of (b) polished cross-section and (c) strut of the gyroid
structure under higher magnification; (d) top view of the as-built structure; (e) first layer of the struts’ connection; (f) staircase effect on the side surface.
for numerical modeling was studied. Two working fluids,
water and silicone oil (used in the experimental study),
were considered. Accordingly, pressure gradients of 1 Pa
and 18 kPa were applied. The effect of working fluid and
pressure gradient was minimal, with 0.4%–0.6% variation
in permeability of the gyroid model, as shown in Figure 5,
proving the consistency of numerical simulations.
Pressure and velocity contours for the fluid domain
prescribed to model 302 are shown in Figure 6.
All studied gyroid structures have monotonous and
regular pressure distribution from the inlet to the
outlet boundary, as demonstrated in Figure 6a. Outlet
boundaries have a uniform magnitude distribution
for all calculations indicating sufficient accuracy and
consistency of the utilized FE model. Maximal velocity
was observed in the central part of the channels, while Figure 5. Effect of working fluid and pressure gradient based on the
calculation results.
the minimum velocity was obtained on the walls of the
formed fluid domain channels, as shown in Figure 6b VIII). The coefficients for the regression equation are given
and c. Similar fluid behavior was demonstrated in in Table 3.
previous studies. 9,18
2
2
A statistical model was built based on the calculations K(a,t) = C + C ∙ a + C ∙ t + C ∙ a + C ∙ t + C ∙ a ∙ t
2
1
0
5
4
3
of the permeability tensor of nine gyroid configurations. (VIII)
Wall thickness and unit cell size were considered The contour plot based on the regression model is shown
continuous dependent variables when permeability was a in Figure 7. The positive correlation of permeability
response variable. A second-order polynomial regression with unit cell size and an inverse relationship with wall
equation with interaction terms was found. The coefficient thickness is observed. The absence of singularities on
of determination higher than 99% indicates the adequacy the contour plot emphasizes the unique definition of a
of the model. Thus, the regression equation for the gyroid structure by the design parameters in comparison
permeability coefficient can be expressed by (Equation with the characterization by a single parametric value of
Volume 10 Issue 1 (2024) 265 https://doi.org/10.36922/ijb.0119