
Page 276 - IJB-10-1
P. 276
International Journal of Bioprinting Permeability of NiTi gyroid scaffolds
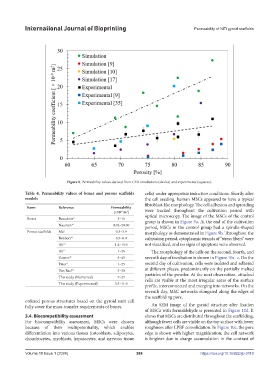
Figure 8. Permeability values derived from CFD simulations (circles) and experiments (squares).
Table 4. Permeability values of bones and porous scaffolds cells) under appropriate induction conditions. Shortly after
models the cell seeding, human MSCs appeared to have a typical
fibroblast-like morphology. The cell adhesion and spreading
Items Reference Permeability
[×10 m ] were tracked throughout the cultivation period with
-9
2
optical microscopy. The image of the MSCs of the control
Bones Beaudoin 15 3–16
group is shown in Figure 9a. At the end of the cultivation
Nauman 16 0.02–20.00
period, MSCs in the control group had a spindle-shaped
Porous scaffolds Ma 9 0.3–3.9 morphology as demonstrated in Figure 9b. Throughout the
Bobbert 35 0.5–8.0 cultivation period, cytoplasmic strands of “stress fibers” were
Ali 10 1.4–15.0 not visualized, and no signs of apoptosis were observed.
Ali 17 1–36 The morphology of the cells on the second, fourth, and
Gomez 36 5–45 seventh day of incubation is shown in Figure 10a–c. On the
Pires 11 1–25 second day of cultivation, cells were isolated and adhered
Van Bael 37 5–30 at different places, predominantly on the partially melted
This study (Numerical) 7–27 particles of the powder. At the next observation, attached
cells are visible at the most irregular areas of the surface
This study (Experimental) 3.5–11.0
profile, interconnected and merging into networks. On the
seventh day, MSC networks elongated along the edges of
the scaffolding pore.
ordered porous structures based on the gyroid unit cell
fully cover the mass-transfer requirements of bones. An SEM image of the gyroid structure after fixation
of MSCs with formaldehyde is presented in Figure 10d. It
3.4. Biocompatibility assessment shows that MSCs are distributed throughout the scaffolding,
For biocompatibility assessment, MSCs were chosen although fewer cells are visible on the top surface with lower
because of their multipotentiality, which enables roughness after LPBF consolidation. In Figure 10e, the pore
differentiation into various tissues (osteoblasts, adipocytes, edge is shown with higher magnification; the cell network
chondrocytes, myoblasts, hepatocytes, and nervous tissue is brighter due to charge accumulation in the contrast of
Volume 10 Issue 1 (2024) 268 https://doi.org/10.36922/ijb.0119