
Page 271 - IJB-10-1
P. 271
International Journal of Bioprinting Permeability of NiTi gyroid scaffolds
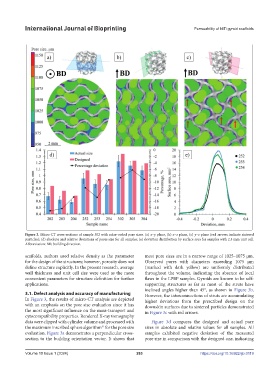
Figure 3. Micro-CT cross-sections of sample 302 with color-coded pore sizes. (a) x–y plane, (b) x–z plane, (c) y–z plane (red arrows indicate sintered
particles); (d) absolute and relative deviations of pores size for all samples; (e) deviation distribution by surface area for samples with 2.5 mm unit cell.
Abbreviation: BD, building direction.
scaffolds, authors used relative density as the parameter most pore sizes are in a narrow range of 1025–1075 μm.
for the design of the structures; however, porosity does not Observed pores with diameters exceeding 1075 μm
define structure explicitly. In the present research, average (marked with dark yellow) are uniformly distributed
wall thickness and unit cell size were used as the more throughout the volume, indicating the absence of local
convenient parameters for structure definition for further flaws in the LPBF samples. Gyroids are known to be self-
applications. supporting structures as far as most of the struts have
inclined angles higher than 45°, as shown in Figure 3b.
3.1. Defect analysis and accuracy of manufacturing However, the interconnections of struts are accumulating
In Figure 3, the results of micro-CT analysis are depicted higher deviations from the prescribed design on the
with an emphasis on the pore size evaluation since it has downskin surfaces due to sintered particles demonstrated
the most significant influence on the mass-transport and in Figure 3c with red arrows.
cytocompatibility properties. Rendered X-ray tomography
data were clipped with cylinder volume and processed with Figure 3d compares the designed and actual pore
the maximum inscribed sphere algorithm for the pore size sizes in absolute and relative values for all samples. All
41
evaluation. Figure 3a demonstrates a perpendicular cross- samples exhibited negative deviation of the measured
section to the building orientation vector. It shows that pore size in comparison with the designed one, indicating
Volume 10 Issue 1 (2024) 263 https://doi.org/10.36922/ijb.0119