
Page 275 - IJB-10-1
P. 275
International Journal of Bioprinting Permeability of NiTi gyroid scaffolds
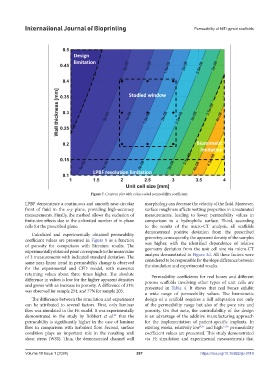
Figure 7. Contour plot with color-coded permeability coefficient.
LPBF demonstrate a continuous and smooth near-circular morphology can decrease the velocity of the fluid. Moreover,
front of fluid in the x-y plane, providing high-accuracy surface roughness affects wetting properties in unsaturated
measurements. Finally, the method allows the exclusion of measurements, leading to lower permeability values in
finite-size effects due to the unlimited number of in-plane comparison to a hydrophilic surface. Third, according
cells for the prescribed plane. to the results of the micro-CT analysis, all scaffolds
demonstrated positive deviation from the prescribed
Calculated and experimentally obtained permeability
coefficient values are presented in Figure 8 as a function geometry; consequently, the apparent density of the samples
was higher, with the identified dependence of relative
of porosity for comparison with literature results. The geometry deviation from the unit cell size via micro-CT
experimentally obtained point corresponds to the mean value analysis demonstrated in Figure 3d. All these factors were
of 3 measurements with indicated standard deviation. The considered to be responsible for the slope difference between
same near-linear trend in permeability change is observed the simulation and experimental results.
for the experimental and CFD model, with numerics
returning values about three times higher. The absolute Permeability coefficients for real bones and different
difference in values is low for the higher apparent densities porous scaffolds involving other types of unit cells are
and grows with an increase in porosity. A difference of 31% presented in Table 4. It shows that real bones exhibit
was observed for sample 254, and 77% for sample 203. a wide range of permeability values. The biomimetic
The difference between the simulation and experiment design of a scaffold requires a full adaptation not only
can be attributed to several factors. First, only laminar of the permeability range but also of the pore size and
flow was simulated in the FE model. It was experimentally porosity. On that note, the controllability of the design
demonstrated in the study by Bobbert et al. that the is an advantage of the additive manufacturing approach
35
permeability is significantly higher in the case of laminar for the implementation of patient-specific implants. In
flow in comparison with turbulent flow. Second, surface existing works, relatively low and high 17,36 permeability
9,35
condition plays an important role in the resulting wall coefficient values are presented. This study demonstrated
shear stress (WSS). Thus, the demonstrated channel wall via FE simulation and experimental measurements that
Volume 10 Issue 1 (2024) 267 https://doi.org/10.36922/ijb.0119