
Page 381 - IJB-10-1
P. 381
International Journal of Bioprinting Design of dual-unit porous scaffold
m m (II) min. The compression direction is parallel to the SLM
P w d 100% construction direction. After the compression test, the
w V d fracture morphology of the scaffold was recorded using
camera, and the recorded test data were derived to
where P is the sample porosity (%); m is the mass of
w
the sample immersed in pure water (g); m is the mass of calculate the elastic modulus and compressive strength
of the scaffolds.
d
the scaffold (g); V is the geometric volume of the porous
d
scaffold (cm ); and ρ is the density of pure water (g/cm ). Finite element analysis software ANSYS 19.0 (ANSYS
3
3
w
Company, USA) was used to simulate the deformation
2.3. Morphology observation of porous scaffolds behavior and stress distribution of porous scaffolds
SEM (JEOLJSM-7800F) was used to observe the surface under compression test. According to a previous work,
33
morphologies of the porous scaffolds. Micro-CT the Young’s modulus, Poisson’s ratio, material density,
(PerkinElmer, Quantum GX II) was used to observe the and compressive strength of the TC4 alloy were set at
internal structure of the porous scaffold. The resolution of 110 GPa, 0.34, 4.51 g/cm , and 1096 MPa, respectively.
3
the internal microstructure of the sample can reach 1–10 The unit type of the grid was tetrahedral, the minimum
μm. The scanning parameters of the equipment were voltage
= 90 kV, current = 80 μA, and scanning time = 14 min. size was 0.1 mm, and the boundary conditions were
set as shown in Figure 4, that is, a displacement load of
2.4. Mechanical properties test and finite element 5% (0.75 mm) is applied to the moving plate at the top
simulation of the scaffold. The stress distribution cloud map and
The porous scaffolds were compressed using stress value were generated, and the stress concentration
compression testing machine at a rate of 0.5 mm/ was determined.
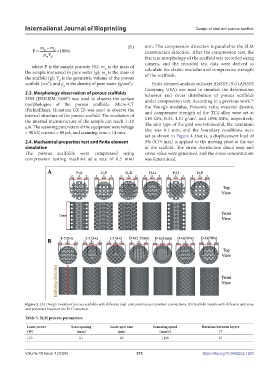
Figure 3. (A) Design models of porous scaffolds with different dual-unit continuous transition connections. (B) Scaffold models with different unit sizes
and porosities based on the D-G structure.
Table 3. SLM process parameters
Laser power Scan spacing Laser spot size Scanning speed Rotation between layers
(W) (mm) (μm) (mm/s) (°)
170 0.1 60 1100 67
Volume 10 Issue 1 (2024) 373 https://doi.org/10.36922/ijb.1263