
Page 384 - IJB-10-1
P. 384
International Journal of Bioprinting Design of dual-unit porous scaffold
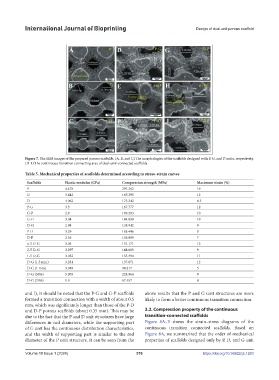
Figure 7. The SEM images of the prepared porous scaffolds. (A, B, and C) The morphologies of the scaffolds designed with P, G, and D units, respectively.
(D–I) The continuous transition connecting area of dual-unit-connected scaffolds.
Table 5. Mechanical properties of scaffolds determined according to stress–strain curves
Scaffolds Elastic modulus (GPa) Compression strength (MPa) Maximum strain (%)
P 4.478 291.262 19
G 3.642 165.295 12
D 4.062 175.242 8.5
P-G 3.3 167.777 12
G-P 2.8 149.203 10
G-D 3.04 144.030 10
D-G 2.98 138.942 9
P-D 3.29 163.446 9
D-P 2.56 136.889 7
4-5 D-G 3.05 131.171 12
2-5 D-G 3.297 148.609 9
1-5 D-G 3.052 155.394 11
D-G (1.5 mm) 3.281 137.871 12
D-G (1 mm) 3.018 94.317 5
D-G (50%) 5.079 228.964 9
D-G (70%) 1.9 67.457 8
and I), it should be noted that the P-G and G-P scaffolds above results that the P and G unit structures are more
formed a transition connection with a width of about 0.5 likely to form a better continuous transition connection.
mm, which was significantly longer than those of the P-D
and D-P porous scaffolds (about 0.35 mm). This may be 3.2. Compression property of the continuous
due to the fact that the P and D unit structures have large transition-connected scaffolds
differences in rod diameters, while the supporting part Figure 8A–E shows the strain–stress diagrams of the
of G unit has the continuous distribution characteristics, continuous transition connected scaffolds. Based on
and the width of supporting part is similar to the rod Figure 8A, we summarized that the order of mechanical
diameter of the P unit structure. It can be seen from the properties of scaffolds designed only by P, D, and G unit
Volume 10 Issue 1 (2024) 376 https://doi.org/10.36922/ijb.1263