
Page 396 - IJB-10-1
P. 396
International Journal of Bioprinting In situ bioprinting for cartilage repair
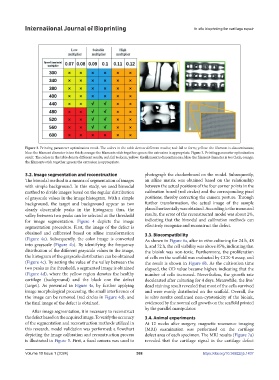
Figure 3. Printing parameter optimization result. The colors in the table denote different results; red: fail to form; yellow: the filament is discontinuous;
blue: the filament diameter is too thick; orange: the filaments stick together; green: the extrusion is appropriate. Figure 3. Printing parameter optimization
result. The colors in the table denote different results; red: fail to form; yellow: the filament is discontinuous; blue: the filament diameter is too thick; orange:
the filaments stick together; green: the extrusion is appropriate.
3.2. Image segmentation and reconstruction photograph the checkerboard on the model. Subsequently,
The bimodal method is a means of segmentation of images an affine matrix was obtained based on the relationship
with simple background. In this study, we used bimodal between the actual positions of the four corner points in the
method to divide images based on the regular distribution calibration board (red circles) and the corresponding pixel
of grayscale values in the image histogram. With a simple positions, thereby correcting the camera posture. Through
background, the target and background appear as two further transformation, the actual image of the sample
clearly discernible peaks in the histogram; thus, the placed horizontally was obtained. According to the measured
valley between two peaks can be selected as the threshold results, the error of the reconstructed model was about 2%,
for image segmentation. Figure 4 depicts the image indicating that the bimodal and calibration methods can
segmentation procedure. First, the image of the defect is effectively recognize and reconstruct the defect.
obtained and calibrated based on affine transformation 3.3. Biocompatibility
(Figure 4a). Subsequently, the color image is converted As shown in Figure 6a, after in vitro culturing for 24 h, 48
into grayscale (Figure 4b). By identifying the frequency h, and 72 h, the cell viability was above 85%, indicating that
distribution of the different grayscale values in the image, the bioink was non-toxic. Furthermore, the proliferation
the histogram of the grayscale distribution can be obtained of cells on the scaffold was evaluated by CCK-8 assay, and
(Figure 4c). By setting the value of the valley between the the result is shown in Figure 6b. As the cultivation time
two peaks as the threshold, a segmented image is obtained elapsed, the OD value became higher, indicating that the
(Figure 4d), where the yellow region denotes the healthy number of cells increased. Nevertheless, the growth rate
cartilage (background) and the black one the defect decelerated after culturing for 4 days. Meanwhile, the live/
(target). As presented in Figure 4e, by further applying dead staining result revealed that most of the cells survived
image morphological processing, the small interference of and were evenly distributed on the scaffold. Overall, the
the image can be removed (red circles in Figure 4d), and in vitro results confirmed non-cytotoxicity of the bioink,
the final image of the defect is obtained. evidenced by the normal cell growth on the scaffold printed
by the parallel manipulator.
After image segmentation, it is necessary to reconstruct
the defect based on the acquired image. To verify the accuracy 3.4. Animal experiments
of the segmentation and reconstruction methods utilized in At 12 weeks after surgery, magnetic resonance imaging
this research, model validation was performed; a flowchart (MRI) examination was performed on the cartilage
depicting the image calibration and reconstruction process defect area of each specimen. The MRI results (Figure 7a)
is illustrated in Figure 5. First, a fixed camera was used to revealed that the cartilage signal in the cartilage defect
Volume 10 Issue 1 (2024) 388 https://doi.org/10.36922/ijb.1437