
Page 489 - IJB-10-1
P. 489
International Journal of Bioprinting Endothelial monolayer formation on scaffolds
The alignment of the cells with the flow was determined per scaffold, and five fibers or pores were measured. To
by measuring the angle between the longest axis of the cell test for normal distribution, the Shapiro–Wilk test was
and the direction of flow. Under static conditions, the angle successfully carried out with a level of significance of p <
between the longest axis of the cell and the scaffold fibers 0.05. Consequently, statistical significance was determined
was chosen. using two-way analysis of variance (ANOVA) with the
Tukey mean comparison method at p < 0.5, p < 0.01, and p
2.6. Mechanical analysis of seeded scaffolds < 0.001, as indicated.
Mechanical properties of MEW/FDM scaffolds were
assessed by tensile testing. Specimens were either incubated 3. Results
in PBS for 7 days at 37°C or coated with fibrin (see section
2.3) and seeded with HUVECs (250,000 cells cm ) as 3.1. Scaffold characterization
-2
previously stated followed by 7 days of cultivation at 37°C. Scaffolds are essential for guiding cell growth and tissue
Specimens were tested using an Instron 5967 (Instron
GmbH, Darmstadt, Germany) with a 100 N load cell. shape. Scaffolds must have appropriate pore size and fiber
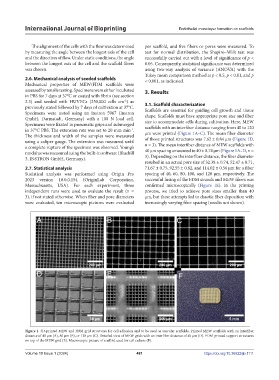
size to accommodate cells during cultivation. Here, MEW
Specimens were fixated in pneumatic grips and submerged scaffolds with an interfiber distance ranging from 40 to 120
in 37°C PBS. The extension rate was set to 20 mm min .
-1
The thickness and width of the samples were measured µm were printed (Figure 1A–C). The mean fiber diameter
using a caliper gauge. The extension was measured until of those printed structures was 7.62 ± 0.84 µm (Figure 1D,
a complete rupture of the specimen was observed. Young’s n = 3). The mean interfiber distance of MEW scaffolds with
modulus was measured using the built-in software (Bluehill 40 µm spacing amounted to 40 ± 0.74 µm (Figure 1A–D, n =
3, INSTRON GmbH, Germany). 3). Depending on the interfiber distance, the fiber diameter
resulted in an actual pore size of 32.38 ± 0.74, 52.47 ± 0.71,
2.7. Statistical analysis 71.67 ± 0.75, 92.55 ± 0.82, and 114.02 ± 0.56 µm for a fiber
Statistical analysis was performed using Origin Pro spacing of 40, 60, 80, 100, and 120 µm, respectively. The
2023 version 10.0.0.154 (OriginLab Corporation, successful fusing of the FDM strands and MEW fibers was
Massachusetts, USA). For each experiment, three confirmed microscopically (Figure 1E). In the printing
independent runs were used to evaluate the result (n = process, we tried to achieve pore sizes smaller than 40
3), if not stated otherwise. When fiber and pore diameters µm, but these attempts led to chaotic fiber deposition with
were evaluated, ten microscopic pictures were evaluated increasingly varying fiber spacing (results not shown).
Figure 1. 3D-printed MEW and FDM grid structures for cell adhesion and to be used as vascular scaffolds. Printed MEW scaffolds with an interfiber
distance of 40 µm (A), 80 µm (B), or 120 µm (C). Detailed view of MEW grids with an interfiber distance of 40 µm (D). FDM-printed support structures
on top of the MEW grid (E). Macroscopic picture of scaffold used for cell culture (F).
Volume 10 Issue 1 (2024) 481 https://doi.org/10.36922/ijb.1111