
Page 70 - IJB-2-1
P. 70
Investigation of process parameters of electrohydrodynamic jetting for 3D printed PCL fibrous scaffolds with complex geometries
was placed on the XYZT stage and moved in accor- the standard deviation (SD) was less than 20 μm. In
dance to the computer program pertaining to the de- fact, most of the data points had a SD of 2–5 μm.
sired geometry, pore size and number of layers. A
square-mesh pattern is used for the optimization stu- 3. Results and Discussion
dies of various parameters and its effects on the fibre 3.1 Effect of Stage Speed on Fibre Diameter
diameter. The traverse path of square-mesh scaffolds is
shown in Figure 3. The effect of varying stage speed on fibre diameter is
shown in Figure 5. Stage speed is varied from 10
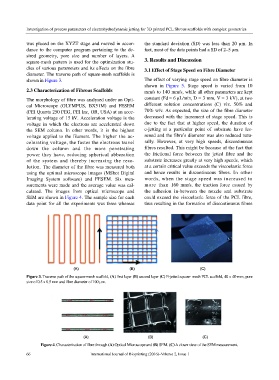
2.3 Characterization of Fibrous Scaffolds mm/s to 140 mm/s, while all other parameters are kept
The morphology of fibre was analysed under an Opti- constant (Fd = 6 μL/min, D = 3 mm, V = 3 kV), at two
cal Microscope (OLYMPUS, BX51M) and FESEM different solution concentrations (C) viz. 50% and
(FEI Quanta 250 FEG, FEI Inc, OR, USA) at an acce- 70% w/v. As expected, the size of the fibre diameter
lerating voltage of 15 kV. Acceleration voltage is the decreased with the increment of stage speed. This is
voltage in which the electrons are accelerated down due to the fact that at higher speed, the duration of
the SEM column. In other words, it is the highest e-jetting at a particular point of substrate have les-
voltage applied to the filament. The higher the ac- sened and the fibre’s diameter was also reduced natu-
celerating voltage, the faster the electrons travel rally. However, at very high speeds, discontinuous
down the column and the more penetrating fibres resulted. This might be because of the fact that
power they have, reducing spherical abberation the frictional force between the jetted fibre and the
of the system and thereby increasing the reso- substrate increases greatly at very high speeds, which
lution. The diameter of the fibre was measured both at a certain critical value exceeds the viscoelastic force
using the optimal microscope images (MShot Digital and hence results in discontinuous fibres. In other
Imaging System software) and FESEM. Six mea- words, when the stage speed was increased to
surements were made and the average value was cal- more than 160 mm/s, the traction force caused by
culated. The images from optical microscope and the adhesion in-between the nozzle and substrate
SEM are shown in Figure 4. The sample size for each could exceed the viscoelastic force of the PCL fibre,
data point for all the experiments was three whereas thus resulting in the formation of discontinuous fibres
Figure 3. Traverse path of the square-mesh scaffold, (A) first layer (B) second layer (C) E-jetted square- mesh PCL scaffold, 40 x 40 mm, pore
size of 0.5 x 0.5 mm and fibre diameter of 100 μm.
Figure 4. Characterization of fibre through (A) Optical Microscope and (B) SEM. (C) A closer view of the SEM measurement.
66 International Journal of Bioprinting (2016)–Volume 2, Issue 1