
Page 243 - IJB-10-2
P. 243
International Journal of Bioprinting G40T60@WNT5A promotes osteoblast differentiation
min for 15 min. The supernatant was extracted, and the BCA internal reference GAPDH. Each experiment was repeated
61
assay kit (23227, TH&Ermo, USA) was used to determine 3 times.
the protein concentration of each sample. Quantification
was performed by adding a 5× loading buffer (P0015, 2.25. Statistical analysis
Beyotime, China)—the volume of which is subjected to the The data was analyzed using SPSS 21.0 (IBM, USA)
concentration of protein—followed by protein separation software. The measurement data was expressed as mean
through polyacrylamide gel electrophoresis. The proteins ± standard deviation. Normality and homogeneity of
were then transferred to a PVDF membrane (IPVH00010, variance tests were conducted. If the data followed a normal
Millipore, Billerica, MA, USA), which was then blocked at distribution and exhibited homogeneity of variance, t-tests
room temperature with 5% bovine serum albumin for 1 h. were used for between-group comparisons. For multiple
After adding antibodies such as rabbit anti-RUNX2 (#12556, group comparisons, one-way analysis of variance (ANOVA)
62 kDa, 1:1000, CST, USA), mouse anti-ALPL (#4747, 80 was used, followed by post hoc tests using Tukey’s method.
kDa, 1:1000, CST, USA), rabbit anti-GAPDH (#92310, Repeated-measures ANOVA combined with post hoc
37 kDa, 1:1000, CST, USA), rabbit anti-Angiopoietin 1 tests using Tukey’s method was conducted for analyzing
antibody (ab8451, 1:1000, Abcam, UK), mouse anti-Pecam1 comparisons between different time points within groups. P
(CD31) antibody (ab9498, 1:1000, Abcam, UK), and rabbit <0.05 indicates that the difference is statistically significant.
anti-VCAM1 antibody (ab134047, 1:1000, Abcam, UK), the
membranes were incubated overnight at 4°C. The next day, 3. Results
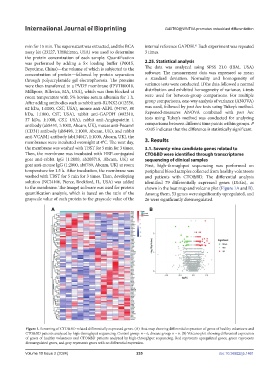
the membrane was washed with TBST for 5 min for 3 times. 3.1. Seventy-nine candidate genes related to
Then, the membrane was incubated with HRP-conjugated CTO&BD were identified through transcriptome
goat anti-rabbit IgG (1:2000, ab205718, Abcam, UK) or sequencing of clinical samples
goat anti-mouse IgG (1:2000, ab6789, Abcam, UK) at room First, high-throughput sequencing was performed on
temperature for 1.5 h. After incubation, the membrane was peripheral blood samples collected from healthy volunteers
washed with TBST for 5 min for 3 times. Then, developing and patients with CTO&BD. The differential analysis
solution (NCI4106, Pierce, Rockford, IL, USA) was added identified 79 differentially expressed genes (DEGs), as
to the membrane. The ImageJ software was used for protein shown in the heat map and volcano plot (Figure 1A and B).
quantification analysis, which is based on the ratio of the Among them, 53 genes were significantly upregulated, and
grayscale value of each protein to the grayscale value of the 26 were significantly downregulated.
Figure 1. Screening of CTO&BD-related differentially expressed genes. (A) Heat map showing differential expression of genes of healthy volunteers and
CTO&BD patients analyzed by high-throughput sequencing. Control group: n = 6, disease group: n = 6. (B) Volcano plot showing differential expression
of genes of healthy volunteers and CTO&BD patients analyzed by high-throughput sequencing. Red represents upregulated genes, green represents
downregulated genes, and gray represents genes with no differential expression.
Volume 10 Issue 2 (2024) 235 doi: 10.36922/ijb.1461