
Page 245 - IJB-10-2
P. 245
International Journal of Bioprinting G40T60@WNT5A promotes osteoblast differentiation
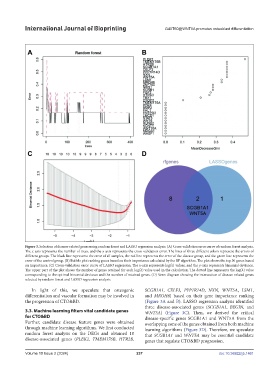
Figure 3. Selection of disease-related genes using random forest and LASSO regression analysis. (A) Cross-validation error curve of random forest analysis.
The x-axis represents the number of trees, and the y-axis represents the cross-validation error. The lines of three different colors represent the errors of
different groups. The black line represents the error of all samples, the red line represents the error of the disease group, and the green line represents the
error of the control group. (B) Bubble plot ranking genes based on their importance calculated by the RF algorithm. The plot shows the top 30 genes based
on importance. (C) Cross-validation error curve of LASSO regression. The x-axis represents log(λ) values, and the y-axis represents binomial deviance.
The upper part of the plot shows the number of genes retained for each log(λ) value used in the calculation. The dotted line represents the log(λ) value
corresponding to the optimal binomial deviance and the number of retained genes. (D) Venn diagram showing the intersection of disease-related genes
selected by random forest and LASSO regression analysis.
In light of this, we speculate that osteogenic SCGB1A1, CELF3, PPP1R14D, NXN, WNT5A, LSM1,
differentiation and vascular formation may be involved in and MROH6) based on their gene importance ranking
the progression of CTO&BD. (Figure 3A and B). LASSO regression analysis identified
three disease-associated genes (SCGB1A1, BEGIN, and
3.3. Machine learning filters vital candidate genes WNT5A) (Figure 3C). Then, we derived the critical
for CTO&BD disease-specific genes SCGB1A1 and WNT5A from the
Further, candidate disease feature genes were obtained overlapping zone of the genes obtained from both machine
through machine learning algorithms. We first conducted learning algorithms (Figure 3D). Therefore, we speculate
random forest analysis on the DEGs and obtained 10 that SCGB1A1 and WNT5A may be essential candidate
disease-associated genes (PLEK2, TMEM176B, HTR2B, genes that regulate CTO&BD progression.
Volume 10 Issue 2 (2024) 237 doi: 10.36922/ijb.1461