Page 379 - IJB-10-2
P. 379

International Journal of Bioprinting                              AM evaluation of medical device companies


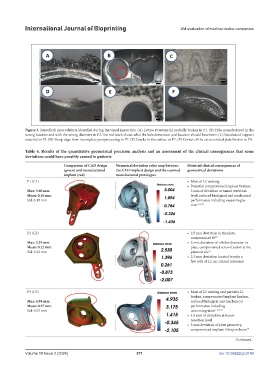
            Figure 3. Superficial macrodefects identified during the visual inspection. (A) Lattice structure L2 partially broken in P1. (B) Hole manufactured in the
            wrong location and with the wrong diameter in P2. The red mark shows what the hole dimension and location should have been. (C) Residues of support
            material in P3. (D) Sharp edge from incomplete postprocessing in P7. (E) Cracks in the surface in P7. (F) Corner of the extra cortical plate broken in P8.

            Table 4. Results  of the  quantitative geometrical  precision  analysis and  an assessment of  the clinical consequences  that some
            deviations could have possibly caused in patients
                            Comparison of CAD design   Numerical deviation color map between   Potential clinical consequences of
                            (green) and manufactured   the CAD implant design and the scanned   geometrical deviations
                            implant (red)         manufactured prototypes
             P1 (C1)                                                             •  Most of L2 missing
                                                                                 •   Potential compromised implant fixation,
             Max: 3.00 mm                                                         3 mm of deviation at tumor resection
             Mean: 0.16 mm                                                        level, reduced biological and mechanical
             Std: 0.19 mm                                                         performance including osseointegra-
                                                                                  tion 15,22,23


             P2 (C2)                                                             •   2.5 mm deviation in the plate,
                                                                                  compromised fit 15
             Max: 2.53 mm                                                        •   2 mm deviation of a hole’s diameter in
             Mean: 0.22 mm                                                        plate, compromised screw fixation at the
             Std: 0.22 mm                                                         planned site 15
                                                                                 •   2.3 mm deviation located in only a
                                                                                  few cells of L2, no clinical relevance


             P3 (C3)                                                             •   Most of L2 missing and partially L1
                                                                                  broken, compromised implant fixation,
             Max: 4.94 mm                                                         reduced biological and mechanical
             Mean: 0.37 mm                                                        performance including
             Std: 0.53 mm                                                         osseointegration 15,22,23
                                                                                 •   4.9 mm of deviation at tumor
                                                                                  resection level
                                                                                 •   3 mm deviation of plate geometry,
                                                                                  compromised implant fitting on bone 15

                                                                                                      Continued...

            Volume 10 Issue 2 (2024)                       371                                doi: 10.36922/ijb.0140
   374   375   376   377   378   379   380   381   382   383   384