
Page 414 - IJB-10-2
P. 414
International Journal of Bioprinting 3D-bioprinted macrophage inflammation model
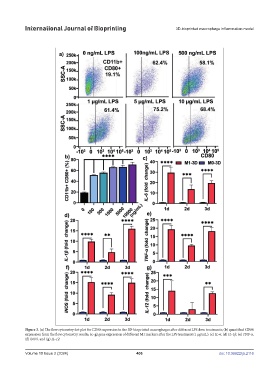
Figure 3. (a) The flow cytometry dot plot for CD80 expression in the 3D-bioprinted macrophages after different LPS dose treatments; (b) quantified CD80
expression from the flow cytometry results; (c–g) gene expression of different M1 markers after the LPS treatment (1 µg/mL): (c) IL-6, (d) IL-1β, (e) TNF-α,
(f) iNOS, and (g) IL-12.
Volume 10 Issue 2 (2024) 406 doi: 10.36922/ijb.2116