
Page 259 - IJB-10-3
P. 259
International Journal of Bioprinting Bioprinting organoids for toxicity testing
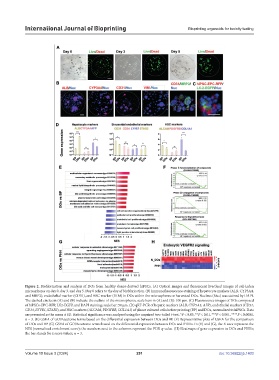
Figure 2. Biofabrication and analysis of DOs from healthy donor-derived hiPSCs. (A) Optical images and fluorescent live/dead images of cell-laden
microspheres on day 0, day 3, and day 5. Day 0 refers to the day of biofabrication. (B) Immunofluorescence staining of hepatocyte markers (ALB, CYP3A4,
and MRP2), endothelial marker (CD31), and HSC marker (VIM) in DOs within the microspheres or harvested DOs. Nucleus (Nuc) was stained by DAPI.
The dashed circles in (A) and (B) indicate the outline of the microspheres; scale bars in (A) and (B): 100 μm. (C) Fluorescence images of DOs composed
of hiPSCs-EPC-RFP, LX2-EGFP, and DAPI staining; scale bar: 50 μm. (D) qRT-PCR of hepatic markers (ALB, CYP3A4, AFP), endothelial markers (CD31,
CD34, LYVE1, STAB2), and HSC markers (ALCAM, PDGFRB, COL1A1) of planar cultured cells before printing (BP) and DOs, normalized to hiPSCs. Data
are presented as the mean ± SD. Statistical significance was analyzed using the unpaired two-tailed t-test, *P < 0.05, **P < 0.01, ***P < 0.001, ****P < 0.0001,
n = 3. (E) GSEA of GO/Reactome terms based on the differential expression between DOs and BP. (F) Representative plots of GSEA for the comparison
of DOs and BP. (G) GSEA of GO/Reactome terms based on the differential expression between DOs and PHHs. In (E) and (G), the X axes represent the
NES (normalized enrichment score); the numbers next to the columns represent the FDR q-value. (H) Heatmaps of gene expression in DOs and PHHs;
the bar stands for z score values, n = 3.
Volume 10 Issue 3 (2024) 251 doi: 10.36922/ijb.1403