
Page 261 - IJB-10-3
P. 261
International Journal of Bioprinting Bioprinting organoids for toxicity testing
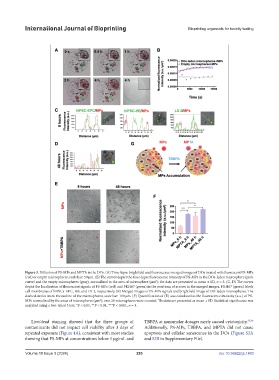
Figure 3. Diffusion of PS-MPs and MPTA in the DOs. (A) Time-lapse brightfield and fluorescence-merged images of DOs treated with fluorescent PS-MPs
(red) or empty microspheres; scale bar: 50 μm. (B) The curves depict the time-lapse fluorescence intensity of PS-MPs in the DOs-laden microsphere (pink
2
curve) and the empty microspheres (gray), normalized to the area of microsphere (μm ); the data are presented as mean ± SD, n = 3. (C, D) The curves
depict the localization of fluorescent signals of PS-MPs (red) and PKH67 (green) in the positions of arrows in the merged images. PKH67 (green) labels
cell membranes of hiPSCs_EPC, HE, and LX-2, respectively. (E) Merged images of PS-MPs signals and brightfield image of DO-laden microspheres. The
dashed circles mark the outline of the microspheres; scale bar: 100 μm. (F) Quantification of (E) was calculated as the fluorescence intensity (a.u.) of PS-
2
MPs normalized by the areas of microspheres (μm ); over 20 microspheres were counted. The data are presented as mean ± SD. Statistical significance was
analyzed using a two-tailed t-test, *P < 0.05, **P < 0.01, ***P < 0.001, n = 3.
Live/dead staining showed that the three groups of TBBPA at nanomolar dosages rarely caused cytotoxicity. 35,36
contaminants did not impact cell viability after 3 days of Additionally, PS-MPs, TBBPA, and MPTA did not cause
repeated exposure (Figure 4A), consistent with most studies apoptosis and cellular senescence in the DOs (Figure S3A
showing that PS-MPs at concentrations below 1 μg/mL and and S3B in Supplementary File).
Volume 10 Issue 3 (2024) 253 doi: 10.36922/ijb.1403