
Page 265 - IJB-10-3
P. 265
International Journal of Bioprinting Bioprinting organoids for toxicity testing
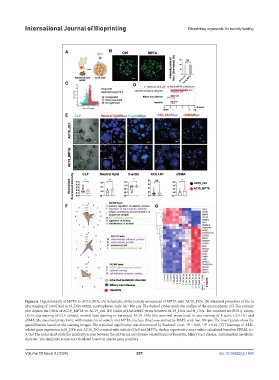
Figure 6. Hepatotoxicity of MPTA to AC19_DOs. (A) Schematic of the toxicity assessment of MPTA with AC19_DOs. (B) Maximal projection of the in
situ staining of Live/Dead in N_DOs within microspheres; scale bar: 100 μm. The dashed circles mark the outline of the microspheres. (C) The volcano
plot depicts the DEGs of AC19_MPTA vs. AC19_ctrl. (D) GSEA of DisGeNET terms between AC19_DOs and N_DOs. The numbers are FDR q-values.
(E) In situ staining of CLF (slides), neutral lipid staining in harvested AC19_DOs (the maximal projection), in situ staining of F-actin, COL1A1 and
αSMA (the maximal projection), with treatments of vehicle and MPTA; nucleus (Nuc) was stained by DAPI; scale bar: 100 μm. The lower panels show the
quantification based on the staining images. The statistical significance was determined by Student’s t-test. *P < 0.05, **P < 0.01. (F) Heatmaps of ALD-
related gene expression in N_DOs and AC19_DOs treated with vehicle (Ctrl) and MPTA; the bar represents z score values calculated based on FPKM, n =
3. (G) The radar chart plots the similarity scores between the GO terms and disease-related terms of hepatitis, biliary tract disease, and inherited metabolic
disorder. The similarity scores are calculated based on shared gene numbers.
Volume 10 Issue 3 (2024) 257 doi: 10.36922/ijb.1403