
Page 262 - IJB-10-3
P. 262
International Journal of Bioprinting Bioprinting organoids for toxicity testing
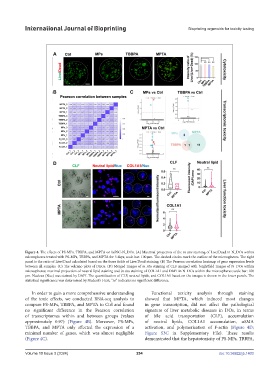
Figure 4. The effects of PS-MPs, TBBPA, and MPTA on hiPSC-N_DOs. (A) Maximal projection of the in situ staining of Live/Dead in N_DOs within
microspheres treated with PS-MPs, TBBPA, and MPTA for 3 days; scale bar: 100 μm. The dashed circles mark the outline of the microspheres. The right
panel is the ratio of Live/Dead calculated based on the three fields of Live/Dead staining. (B) The Pearson correlation heatmap of gene expression levels
between all samples. (C) The volcano plots of DEGs. (D) Merged images of in situ staining of CLF merged with brightfield images of N_DOs within
microspheres; maximal projection of neutral lipid staining and in situ staining of COL1A1 and DAPI in N_DOs within the microspheres; scale bar: 100
μm. Nucleus (Nuc) was stained by DAPI. The quantification of CLF, neutral lipids, and COL1A1 based on the images is shown in the lower panels. The
statistical significance was determined by Student’s t-test; “ns” indicates no significant difference.
In order to gain a more comprehensive understanding Functional toxicity analysis through staining
of the toxic effects, we conducted RNA-seq analysis to showed that MPTA, which induced most changes
compare PS-MPs, TBBPA, and MPTA to Ctrl and found in gene transcription, did not affect the pathological
no significant difference in the Pearson correlation signature of liver metabolic diseases in DOs, in terms
of transcriptomes within and between groups (values of bile acid transportation (CLF), accumulation
approximately 0.97) (Figure 4B). Moreover, PS-MPs, of neutral lipids, COL1A1 accumulation, αSMA
TBBPA, and MPTA only affected the expression of a activation, and polymerization of F-actin (Figure 4D;
minimal number of genes, which was almost negligible Figure S3C in Supplementary File). These results
(Figure 4C). demonstrated that the hepatotoxicity of PS-MPs, TBBPA,
Volume 10 Issue 3 (2024) 254 doi: 10.36922/ijb.1403