
Page 319 - IJB-10-3
P. 319
International Journal of Bioprinting 3D-bioprinted hydrogel for pulp regeneration
environmental conditions. In the preclinical evaluation in DPGC. As a result, the optical density (OD) value in
42
of biocompatibility (Figure 5C), hDPSCs-laden DPGCs the DPGC group was significantly higher than that in
were implanted subcutaneously into immunodeficient the control group after 7 days of incubation (Figure 5B).
mice. After 7 and 14 days of implantation, no Furthermore, the migration of hDPSCs encapsulated in the
inflammatory response, necrosis, or metaplasia was found DPGCs or bulk GelMA hydrogel constructs was detected
within the constructs in both DPGC and control groups, with a transwell assay. As shown in Figure 5D and E, the
demonstrating the high biosafety and biocompatibility result suggested that the number of migrated hDPSCs in
of the GelMA hydrogel constructs. The in vivo results the DPGC group was approximately significantly 2.6-fold
were also consistent with the in vitro findings, showing higher than that in the control group.
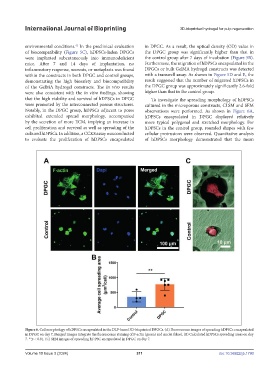
that the high viability and survival of hDPSCs in DPGC To investigate the spreading morphology of hDPSCs
were promoted by the interconnected porous structures. cultured in the microporous constructs, CLSM and SEM
Notably, in the DPGC group, hDPSCs adjacent to pores observations were performed. As shown in Figure 6A,
exhibited extended spread morphology, accompanied hDPSCs encapsulated in DPGC displayed relatively
by the secretion of more ECM, implying an increase in more typical polygonal and stretched morphology. For
cell proliferation and survival as well as spreading of the hDPSCs in the control group, rounded shapes with few
cultured hDPSCs. In addition, a CCK8 assay was conducted cellular protrusions were observed. Quantitative analysis
to evaluate the proliferation of hDPSCs encapsulated of hDPSCs morphology demonstrated that the mean
Figure 6. Cell morphology of hDPSCs encapsulated in the DLP-based 3D-bioprinted DPGCs. (A) Fluorescence images of spreading hDPSCs encapsulated
in DPGC on day 7. Merged images integrate the fluorescence staining of F-actin (green) and nuclei (blue). (B) Calculated hDPSCs spreading areas on day
7. **p < 0.01. (C) SEM images of spreading hDPSC encapsulated in DPGC on day 7.
Volume 10 Issue 3 (2024) 311 doi: 10.36922/ijb.1790