
Page 132 - IJB-4-2
P. 132
Mandt D, et al.
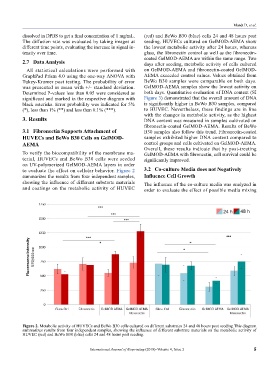
dissolved in DPBS to get a final concentration of 1 mg/mL. (red) and BeWo B30 (blue) cells 24 and 48 hours post
The diffusion rate was evaluated by taking images at seeding. HUVECs cultured on GelMOD-AEMA show
different time points, evaluating the increase in signal in- the lowest metabolic activity after 24 hours, whereas
tensity over time. glass, the fibronectin control as well as the fibronectin-
coated GelMOD-AEMA are within the same range. Two
2.7 Data Analysis days after seeding, metabolic activity of cells cultured
All statistical calculations were performed with on GelMOD-AEMA and fibronectin-coated GelMOD-
GraphPad Prism 4.0 using the one-way ANOVA with AEMA exceeded control values. Values obtained from
Tukey-Kramer post testing. The probability of error BeWo B30 samples were comparable on both days.
was presented as mean with +/- standard deviation. GelMOD-AEMA samples show the lowest activity on
Determined P-values less than 0.05 were considered as both days. Quantitative evaluation of DNA content (SI
significant and marked in the respective diagram with Figure 3) demonstrated that the overall amount of DNA
black asterisks. Error probability was indicated for 5% is significantly higher in BeWo B30 samples, compared
(*), less than 1% (**) and less than 0.1% (***). to HUVEC. Nevertheless, these findings are in line
with the changes in metabolic activity, as the highest
3. Results DNA content was measured in samples cultivated on
fibronectin-coated GelMOD-AEMA. Results of BeWo
3.1 Fibronectin Supports Attachment of B30 samples also follow this trend. Fibronectin-coated
HUVECs and BeWo B30 Cells on GelMOD- samples exhibited higher DNA content compared to
AEMA control groups and cells cultivated on GelMOD-AEMA.
Overall, these results indicate that by post-treating
To verify the biocompatibility of the membrane ma- GelMOD-AEMA with fibronectin, cell survival could be
terial, HUVECs and BeWo B30 cells were seeded significantly improved.
on UV-polymerized GelMOD-AEMA layers in order
to evaluate the effect on cellular behavior. Figure 2 3.2 Co-culture Media does not Negatively
summarizes the results from four independent samples, Influence Cell Growth
showing the influence of different substrate materials The influence of the co-culture media was analyzed in
and coatings on the metabolic activity of HUVEC order to evaluate the effect of possible media mixing
Figure 2. Metabolic activity of HUVECs and BeWo B30 cells cultured on different substrates 24 and 48 hours post seeding.This diagram
summarizes results from four independent samples, showing the influence of different substrate materials on the metabolic activity of
HUVEC (red) and BeWo B30 (blue) cells 24 and 48 hours post seeding.
International Journal of Bioprinting (2018)–Volume 4, Issue 2 5