
Page 133 - IJB-4-2
P. 133
Fabrication of biomimetic placental barrier structures within a microfluidic device utilizing two-photon polymerization
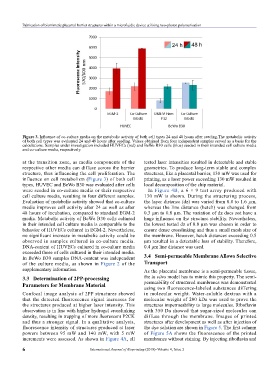
Figure 3. Influence of co-culture media on the metabolic activity of both cell types 24 and 48 hours after seeding.The metabolic activity
of both cell types was evaluated 24 and 48 hours after seeding. Values obtained from four independent samples served as a basis for the
calculations. Samples under investigation included HUVECs (red) and BeWo B30 cells (blue) seeded in their intended cell culture media
and co-culture media, respectively.
at the transition zone, as media components of the tested laser intensities resulted in detectable and stable
respective other media can diffuse across the barrier geometries. To produce long-term stable and complex
structure, thus influencing the cell proliferation. The structures, like a placental barrier, 130 mW was used for
influence on cell metabolism (Figure 3) of both cell printing, as a laser power exceeding 130 mW resulted in
types, HUVEC and BeWo B30 was evaluated after cells local decomposition of the chip material.
were seeded in co-culture media or their respective In Figure 4B, a 6 × 9 test array produced with
cell culture media, resulting in four different samples. 130 mW is shown. During the structuring process,
Evaluation of metabolic activity showed that co-culture the layer distance (dz) was varied from 0.8 to 1.6 µm,
media improves cell activity after 24 as well as after whereas the line distance (hatch) was changed from
48 hours of incubation, compared to standard EGM-2 0.3 µm to 0.8 µm. The variation of dz does not have a
media. Metabolic activity of BeWo B30 cells cultured huge influence on the structure stability. Nevertheless,
in their intended cell culture media is comparable to the the lowest tested dz of 0.8 µm was chosen in order to
behavior of HUVECs cultured in EGM-2. Nevertheless, ensure dense crosslinking and thus a small mesh size of
no significant increase in metabolic activity could be the membrane. However, hatch distances exceeding 0.5
observed in samples cultured in co-culture media. µm resulted in a detectable loss of stability. Therefore,
DNA-content of HUVECs cultured in co-culture media 0.4 µm line distance was used.
exceeded those of cells cultured in their intended media.
In BeWo B30 samples DNA-content was independent 3.4 Semi-permeable Membrane Allows Selective
of the culture media, as shown in Figure 2 of the transport
supplementary information. As the placental membrane is a semi-permeable tissue,
3.3 Determination of 2PP-processing the in vitro model has to mimic this property. The semi-
Parameters for Membrane Material permeability of structured membranes was demonstrated
using two fluorescence-labeled substances differing
Confocal image analysis of 2PP structures showed in molecular weight. Water-soluble dextran with a
that the detected fluorescence signal increases for molecular weight of 200 kDa was used to prove the
the structures produced at higher laser intensity. This structures impermeability to large molecules. Riboflavin
observation is in line with higher hydrogel crosslinking with 350 Da showed that sugar-sized molecules can
density, resulting in trapping of more fluorescent P2CK diffuse through the membrane. Images of printed
and thus a stronger signal. In a qualitative analysis, structures after development as well as after injection of
fluorescence intensity of structures produced at laser the dye solution are shown in Figure 5. The first column
powers between 95 mW and 140 mW, with 5 mW of Figure 5A shows the fluorescence of the printed
increments were assessed. As shown in Figure 4A, all membranes without staining. By injecting riboflavin and
6 International Journal of Bioprinting (2018)–Volume 4, Issue 2