
Page 134 - IJB-4-2
P. 134
Mandt D, et al.
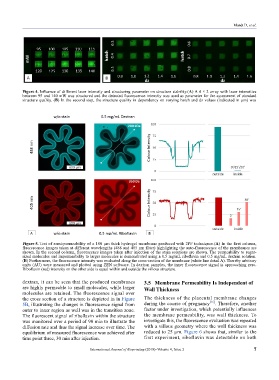
Figure 4. Influence of different laser intensity and structuring parameter on structure stability.(A) A 4 × 2 array with laser intensities
between 95 and 140 mW was structured and the detected fluorescence intensity was used as parameter for the assessment of standard
structure quality. (B) In the second step, the structure quality in dependency on varying hatch and dz values (indicated in µm) was
Figure 5. Test of semi-permeability of a 100 µm thick hydrogel membrane produced with 2PP techniques.(A) In the first column,
fluorescence images taken at different wavelengths (488 and 405 nm filter) highlighting the auto-fluorescence of the membranes are
shown. In the second column, fluorescence images taken after injection of the stain solutions are shown. The permeability to sugar-
sized molecules and impermeability to larger molecules is demonstrated using a 0.5 mg/mL riboflavin and 0.5 mg/mL dextran solution.
(B) Furthermore, the fluorescence intensity was evaluated along the cross-section of the membrane (white line detail A). Thereby arbitrary
units (AU) were measured and plotted using ZEN software. In dextran samples, the inner fluorescence signal is approaching zero.
Riboflavin (red) intensity on the other side is equal within and outside the villous structure.
dextran, it can be seen that the produced membranes 3.5 Membrane Permeability is independent of
are highly permeable to small molecules, while larger Wall thickness
molecules are retained. The fluorescence signal over
the cross section of a structure is depicted in in Figure The thickness of the placental membrane changes
5B, illustrating the changes in fluorescence signal from during the course of pregnancy [16] . Therefore, another
outer to inner region as well was in the transition zone. factor under investigation, which potentially influences
The fluorescent signal of riboflavin within the structure the membrane permeability, was wall thickness. To
was monitored over a period of 90 min to illustrate the investigate this, the fluorescence evaluation was repeated
diffusion rate and thus the signal increase over time. The with a villous geometry where the wall thickness was
equilibrium of measured fluorescence was achieved after reduced to 25 µm. Figure 6 shows that, similar to the
time point three, 30 min after injection. first experiment, riboflavin was detectable on both
International Journal of Bioprinting (2018)–Volume 4, Issue 2 7