
Page 94 - IJB-4-2
P. 94
Optimized vascular network by stereolithography for tissue engineered skin
(A) (B) (C)
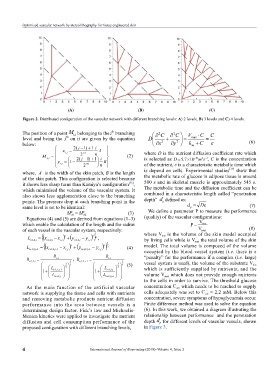
Figure 2. Distributed configuration of the vascular network with different branching levels: A) 2 levels, B) 3 levels and C) 4 levels.
th
The position of a point belonging to the branching
level and being the th on it are given by the equation
below: (6)
(2) where D is the nutrient diffusion coefficient rate which
is selected as , C is the concentration
of the nutrient, is a characteristic metabolic time which
[39]
where, A is the width of the skin patch, B is the length is depend on cells. Experimental studies show that
of the skin patch. This configuration is selected because the metabolic rate of glucose in adipose tissue is around
it shows less sharp turns than Kamiya’s configuration , 500 s and in skeletal muscle is approximately 545 s.
[38]
which minimised the volume of the vascular system. It The metabolic time and the diffusion coefficient can be
also shows less agglomeration close to the branching combined in a characteristic length called “penetration
points. The pressure drop at each branching point in the depth” defined as:
same level is set to be identical: (7)
(3) We define a parameter P to measure the performance
Equations (4) and (5) are derived from equations (1–3) (quality) of the vascular configurations:
which enable the calculation of the length and the radius
of each vessel in the vascular system, respectively: (8)
where is the volume of the skin model occupied
by living cells while is the total volume of the skin
(4) model. The total volume is composed of the volume
occupied by the blood vessel system (i.e. there is a
“penalty” for the performance if a complex (i.e. large)
(5) vessel system is used), the volume of the substrate
which is sufficiently supplied by nutrients, and the
volume which does not provide enough nutrients
to the cells in order to survive. The threshold glucose
As the main function of the artificial vascular concentration which needs to be reached to supply
network is supplying the tissue and cells with nutrients cells adequately was set to = 2.2 mM. Below this
and removing metabolic products nutrient diffusion concentration, severe symptoms of hypoglycaemia occur.
performance into the area between vessels is a Finite difference method was used to solve the equation
determining design factor. Fick’s law and Michaelis- (6). In this work, we obtained a diagram illustrating the
Menten kinetics were applied to investigate the nutrient relationship between performance and the penetration
diffusion and cell consumption performance of the depth for different levels of vascular vessels, shown
proposed configuration with different branching levels, in Figure 3.
4 International Journal of Bioprinting (2018)–Volume 4, Issue 2