
Page 262 - IJB-10-4
P. 262
International Journal of Bioprinting Cell viability in printing structured inks
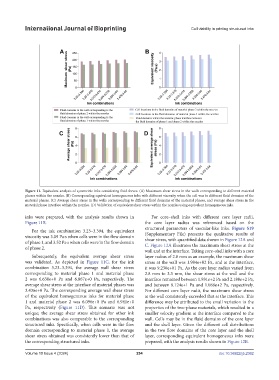
Figure 11. Equivalent analysis of symmetric inks considering fluid forces. (A) Maximum shear stress in the walls corresponding to different material
phases within the nozzles. (B) Corresponding equivalent homogeneous inks with different viscosity when the cell was in different fluid domains of the
material phases. (C) Average shear stress in the walls corresponding to different fluid domains of the material phases, and average shear stress in the
material phase interface within the nozzles. (D) Validation of equivalent shear stress within the nozzles using equivalent homogeneous inks.
inks were prepared, with the analysis results shown in For core–shell inks with different core layer radii,
Figure 11B. the core layer radius was referenced based on the
structured parameters of vascular-like inks. Figure S19
For the ink combination 3.23–3.394, the equivalent
viscosity was 3.09 Pa·s when cells were in the flow domain (Supplementary File) presents the qualitative results of
shear stress, with quantified data shown in Figure 12A and
of phase 1, and 3.52 Pa·s when cells were in the flow domain C. Figure 12A illustrates the maximum shear stress at the
of phase 2.
wall and at the interface. Taking core–shell inks with a core
Subsequently, the equivalent average shear stress layer radius of 2.8 mm as an example, the maximum shear
was validated. As depicted in Figure 11C, for the ink stress at the wall was 1.984e+02 Pa, and at the interface,
combination 3.23–3.394, the average wall shear stress it was 9.230e+01 Pa. As the core layer radius varied from
corresponding to material phase 1 and material phase 2.8 mm to 3.3 mm, the shear stress at the wall and the
2 was 6.630e+0 Pa and 6.867e+0 Pa, respectively. The interface remained between 1.931e+2 Pa and 2.188e+2 Pa,
average shear stress at the interface of material phases was and between 8.124e+1 Pa and 1.088e+2 Pa, respectively.
3.436e+0 Pa. The corresponding average wall shear stress For different core layer radii, the maximum shear stress
of the equivalent homogeneous inks for material phase at the wall consistently exceeded that at the interface. This
1 and material phase 2 was 6.096e+0 Pa and 6.941e+0 difference may be attributed to the small variation in the
Pa, respectively (Figure 11D). This scenario was not properties of the two-phase materials, which resulted in a
unique; the average shear stress obtained for other ink smaller velocity gradient at the interface compared to the
combinations was also comparable to the corresponding wall. Cells may be in the fluid domains of the core layer
structured inks. Specifically, when cells were in the flow and the shell layer. Given the different cell distributions
domain corresponding to material phase 1, the average in the two flow domains of the core layer and the shell
shear stress obtained was consistently lower than that of layer, corresponding equivalent homogeneous inks were
the corresponding structured inks. prepared, with the analysis results shown in Figure 12B.
Volume 10 Issue 4 (2024) 254 doi: 10.36922/ijb.2362