
Page 258 - IJB-10-4
P. 258
International Journal of Bioprinting Cell viability in printing structured inks
Figure 8A–C presents simulation results corresponding to (Supplementary File). Figure 9D–F presents the quantified
parameters (r , r , and φ). The corresponding quantitative data of average and maximum shear stress for r , r , and φ,
4
3
4
3
results for the parameters are provided in Table S3 respectively. Their corresponding qualitative results of shear
(Supplementary File). When r and φ were fixed at 2.575 stress are shown in Figures S14 and S15 (Supplementary
4
mm and 13.3°, respectively, increasing the value of r File). The average shear stresses at the nozzle wall, the
3
′
resulted in an augmentation of the inner layer r (Table interface between material phases 1 and 2 within the
3
S3 in Supplementary File), as the increase in r led to an nozzle, and the interface between material phases 2 and
3
increase in its volume flow rate. With a value of r set at 3 within the nozzle were determined to be 6.656e+0 Pa,
3
′
1.65 mm, the inner layer r equaled 0.105 mm, indicating 5.237e+0 Pa, and 1.721e+0 Pa, respectively. In comparison,
3
that material phase 3 at the nozzle outlet accounted for 1/4 the average wall shear stress generated in conventional
of the overall fiber diameter. Subsequently, the parameter printing was 1.60e+1 Pa (Figure S13B in Supplementary
r was determined by fixing r at 1.65 mm and φ at 13.3°. File), which is larger than that in the structured inks-
3
4
′
′
When r had a value of 2.575 mm, the ratio of rtor based methods. Furthermore, the maximum shear stress
4
3
presents a distinct difference. In hepatic lobule analogue-
4
reached 2:1. Furthermore, the parameter φ was determined like printing, the maximum shear stress was 1.583e+2 Pa,
by fixing r at 1.65 mm and r at 2.575 mm. When φ had markedly lower than the wall shear stress produced in
3
4
a value of 13.3°, the ratio of ′ 5 4 ′ rtor reached 1:1. Thus, the conventional printing, which was 5.146e+3 Pa.
geometric parameters of hepatic lobule analogue-like inks
were determined. 3.4. Pre-consideration of fluid forces for
The fluid forces were analyzed using the structured ink equivalent analysis
with determined parameters: r of 1.65 mm, r of 2.575 mm, The purpose of equivalent analysis is to identify a
4
3
and φ of 13.3°. Figure 9A–C presents the quantified data of homogeneous ink that generates fluid forces equivalent
average and maximum pressure for r , r , and φ respectively, to those experienced by cells in structured ink-based
4
3
with their corresponding qualitative results of pressure printing. This homogeneous ink shares the same nozzle
shown in Figure S12 (Supplementary File). The average specifications and overall flow domain as structured inks.
30
pressure within the fluid domain of material phase 2 within In a previous research, it was ensured that the velocity
the nozzles was measured at 1.028e+3 Pa, with a maximum at the inlet of the homogeneous ink was equal to that of
pressure of 1.065e+3 Pa. Figure 3D, E, G, and H presents the structured inks. This consideration is made from the
perspective of identical printing process parameters. In the
the contour of fluid forces in corresponding conventional preceding two sections, the forces generated by vascular-
printing, with quantified data shown in Figure S13 like inks or hepatic lobule analogue-like inks with different
(Supplementary File). Notably, the average and maximum
pressures in this structured ink were significantly lower structured parameters were analyzed.
than those in conventional printing, where the average Based on Figure 7A and C (an increase in r from 3.00
1
pressure was 2.750e+4 Pa, as depicted in Figure S13A mm to 3.20 mm with r set to 1.155 mm), and Figure
2
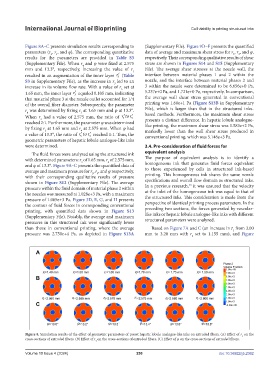
Figure 8. Simulation results of the effect of geometric parameters of preset hepatic lobule analogue-like inks on extruded fibers. (A) Effect of r on the
3
cross-sections of extruded fibers. (B) Effect of r on the cross-sections of extruded fibers. (C) Effect of φ on the cross-sections of extruded fibers.
4
Volume 10 Issue 4 (2024) 250 doi: 10.36922/ijb.2362