
Page 365 - IJB-10-4
P. 365
International Journal of Bioprinting 3D-printed PEEK in cranioplasty
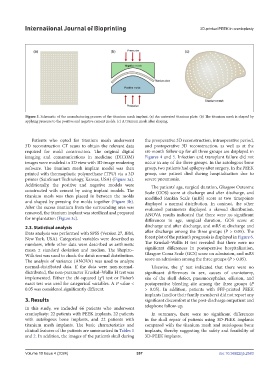
Figure 3. Schematic of the manufacturing process of the titanium mesh implant. (a) An untreated titanium plate. (b) The titanium mesh is shaped by
applying pressure to the positive and negative cement molds. (c) A titanium mesh after shaping.
Patients who opted for titanium mesh underwent the preoperative 3D reconstruction, intraoperative period,
3D reconstruction CT scans to obtain the relevant data and postoperative 3D reconstruction, as well as at the
required for mold construction. The original digital six-month follow-up for all three groups are displayed in
imaging and communications in medicine (DICOM) Figures 4 and 5. Infection and transplant failure did not
images were modeled in 3D view with 3D image rendering occur in any of the three groups. In the autologous bone
software. The titanium mesh implant model was then group, two patients had epilepsy after surgery. In the PEEK
printed with thermoplastic polyurethane (TPU) via a 3D group, one patient died during hospitalization due to
printer (SainSmart Technology, Kansas, USA) (Figure 3a). severe pneumonia.
Additionally, the positive and negative models were The patients’ age, surgical duration, Glasgow Outcome
constructed with cement by using implant models. The Scale (GOS) score at discharge and after discharge, and
titanium mesh was then placed in between the molds modified Rankin Scale (mRS) score at two timepoints
and shaped by pressing the molds together (Figure 3b). displayed a normal distribution. In contrast, the other
After the excess titanium from the surrounding area was evaluated parameters displayed a skewed distribution.
removed, the titanium implant was sterilized and prepared ANOVA results indicated that there were no significant
for implantation (Figure 3c). differences in age, surgical duration, GOS score at
2.3. Statistical analysis discharge and after discharge, and mRS at discharge and
Data analysis was performed with SPSS (Version 27, IBM, after discharge among the three groups (P > 0.05). The
New York, USA). Categorical variables were described as forest plot of the patient’s prognosis is displayed in Figure 6.
numbers, while other data were described as arithmetic The Kruskal–Wallis H test revealed that there were no
mean ± standard deviation and median. The Shapiro– significant differences in postoperative hospitalization,
Wilk test was used to check the data’s normal distribution. Glasgow Coma Scale (GCS) score on admission, and mRS
The analysis of variance (ANOVA) was used to analyze score on admission among the three groups (P > 0.05).
normal-distributed data. If the data were non-normal- Likewise, the χ test indicated that there were no
2
distributed, the non-parameter Kruskal–Wallis H test was significant differences in sex, causes of craniotomy,
implemented. Either the chi-squared (χ ) test or Fisher’s site of the skull defect, pneumocephalus, effusion, and
2
exact test was used for categorical variables. A P value < postoperative bleeding site among the three groups (P
0.05 was considered significantly different. > 0.05). In addition, patients with FFF-printed PEEK
implants (and/or their family members) did not report any
3. Results significant discomfort at the post-discharge outpatient and
In this study, we included 66 patients who underwent telephone follow-up.
cranioplasty: 22 patients with PEEK implants, 22 patients In summary, there were no significant differences
with autologous bone implants, and 22 patients with in the skull repair of patients using 3D-PEEK implants
titanium mesh implants. The basic characteristics and compared with the titanium mesh and autologous bone
clinical features of the patients are summarized in Tables 1 implants, thereby suggesting the safety and feasibility of
and 2. In addition, the images of the patient’s skull during 3D-PEEK implants.
Volume 10 Issue 4 (2024) 357 doi: 10.36922/ijb.2583