
Page 110 - IJB-5-1
P. 110
Electrohydrodynamic printing process monitoring by microscopic image identification
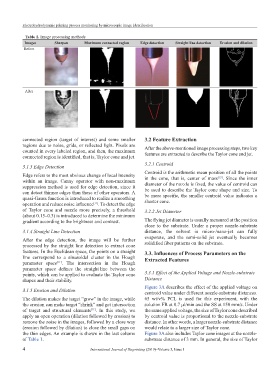
Table 1. Image processing methods
Images Sharpen Maximum connected region Edge detection Straight line detection Erosion and dilation
Before
After
connected region (target of interest) and some smaller 3.2 Feature Extraction
regions due to noise, grids, or reflected light. Pixels are After the above-mentioned image processing steps, two key
counted in every labeled region, and then, the maximum
connected region is identified, that is, Taylor cone and jet. features are extracted to describe the Taylor cone and jet.
3.2.1 Centroid
3.1.3 Edge Detection
Centroid is the arithmetic mean position of all the points
Edge refers to the most obvious change of local intensity in the cone, that is, center of mass . Since the inner
[12]
within an image. Canny operator with non-maximum
suppression method is used for edge detection, since it diameter of the nozzle is fixed, the value of centroid can
be used to describe the Taylor cone shape and size. To
can detect thinner edges than those of other operators. A be more specific, the smaller centroid value indicates a
quasi-Gauss function is introduced to realize a smoothing
operation and reduce noise influence . To detect the edge shorter cone.
[11]
of Taylor cone and nozzle more precisely, a threshold 3.2.2 Jet Diameter
(about 0.15–0.3) is introduced to determine the minimum
gradient according to the brightness and contrast. The flying jet diameter is usually measured at the position
close to the substrate. Under a proper nozzle-substrate
3.1.4 Straight Line Detection distance, the solvent in micro-/nano-jet can fully
After the edge detection, the image will be further evaporate, and the semi-solid jet eventually becomes
processed by the straight line detection to extract cone solidified fiber patterns on the substrate.
features. In the Euclidean space, the points on a straight 3.3. Influences of Process Parameters on the
line correspond to a sinusoidal cluster in the Hough Extracted Features
parameter space . The intersection in the Hough
[11]
parameter space defines the straight line between the
points, which can be applied to evaluate the Taylor cone 3.3.1 Effect of the Applied Voltage and Nozzle-substrate
shapes and their stability. Distance
Figure 3A describes the effect of the applied voltage on
3.1.5 Erosion and Dilation centroid value under different nozzle-substrate distances.
The dilation makes the target “grow” in the image, while 65 wt/v% PCL is used for this experiment, with the
the erosion can make target “shrink” and get intersection solution FR at 0.7 μl/min and the SS at 150 mm/s. Under
of target and structural elements . In this study, we the same applied voltage, the size of Taylor cone described
[11]
apply an open operation (dilation followed by erosion) to by centroid value is proportional to the nozzle-substrate
remove the noise in the images, followed by a close way distance. In other words, a larger nozzle-substrate distance
(erosion followed by dilation) to close the small gaps on would relate to a larger size of Taylor cone.
the thin edges. An example is shown in the last column Figure 3A also includes Taylor cone images at the nozzle-
of Table 1. substrate distance of 3 mm. In general, the size of Taylor
4 International Journal of Bioprinting (2019)–Volume 5, Issue 1