
Page 113 - IJB-5-1
P. 113
Sun J, et al.
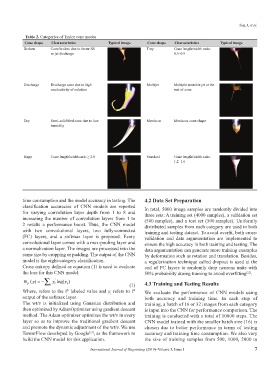
Table 2. Categories of Taylor cone modes
Cone shape Characteristics Typical image Cone shape Characteristics Typical image
Broken Cone broken due to faster SS Tiny Cone length/width ratio:
or jet discharge 0.5–0.9
Discharge Discharge cone due to high Multijet Multiple unstable jet at the
conductivity of solution end of cone
Dry Semi-solidified cone due to low Meniscus Meniscus cone shape
humidity
Huge Cone length/width ratio ≥ 2.0 Standard Cone length/width ratio:
1.2–1.6
time consumption and the model accuracy in testing. The 4.2 Data Set Preparation
classification accuracies of CNN models are reported In total, 5000 image samples are randomly divided into
for varying convolution layer depth from 1 to 8 and three sets: A training set (4000 samples), a validation set
increasing the number of convolution layers from 1 to (500 samples), and a test set (500 samples). Uniformly
2 results a performance boost. Thus, the CNN model distributed samples from each category are used in both
with two convolutional layers, two fully-connected training and testing dataset. To avoid overfit, both cross-
(FC) layers, and a softmax layer is proposed. Every validation and data argumentation are implemented to
convolutional layer comes with a max-pooling layer and ensure the high accuracy in both training and testing. The
a normalization layer. The images are processed into the data argumentation can generate more training examples
same size by cropping or padding. The output of the CNN by deformation such as rotation and translation. Besides,
model is the eight-category classification. a regularization technique called dropout is used at the
Cross entropy defined as equation (1) is used to evaluate end of FC layers to randomly drop neurons units with
the loss for this CNN model. 50% probability during training to avoid overfitting .
[22]
H ( )y = − ∑ i y i ' log( )y i (1) 4.3 Training and Testing Results
y
Where, refers to the i labeled value and y refers to i We evaluate the performance of CNN models using
th
th
i
output of the softmax layer. both accuracy and training time. In each step of
The wt/v is initialized using Gaussian distribution and training, a batch of 16 or 32 images from each category
then optimized by AdamOptimizer using gradient descent is input into the CNN for performance comparison. The
method. The Adam optimizer optimizes the wt/v in every training is conducted with a total of 10000 steps. The
layer so as to improve the traditional gradient descent CNN model trained with the smaller batch size (16) is
and promote the dynamic adjustment of the wt/v. We use chosen due to better performance in terms of testing
TensorFlow developed by Google , as the framework to accuracy and training time consumption. We also vary
[21]
build the CNN model for this application. the size of training samples from 500, 1000, 2000 to
International Journal of Bioprinting (2019)–Volume 5, Issue 1 7