
Page 109 - IJB-5-1
P. 109
Sun J, et al.
2.2 Monitoring System Setup vary from one process run to another. Thus, we need
Our monitoring region focuses on the EHDP Taylor to interpret these monitoring images by acquisition,
segmentation, and feature extraction.
cone and its jet. Since the captured images were strongly
influenced by the lighting conditions, an adjustable LED 3.1 Image Processing
light source is introduced in a reflective way to ensure
good image quality. The EHDP process is video recorded Some cones can be distinguished from the background
by a Supereyes B011 digital microscope with 200 in the captured images. Thus, the image processing
magnification and 30 frames per second. One can view would start with binarization, followed by the detection
and analyze microscale features of the observation region of maximum connected region. For those images, the
on a computer screen. The camera position and shooting binarization with a single threshold may not be sufficiently
angle are calibrated by aligning the area of the gray scale to extract the cone images from the background. A
nozzle image with a predefined nozzle position. method named “sharpen” will be implemented, followed
Figure 2A shows a standard EHDP cone shape with by edge detection, dilation, and erosion. These processing
a straight jet. Figure 2B shows a cone jet with helical methods are briefly described as below. Table 1 shows the
deformation which consists of two distinct parts: A long, images before and after each processing method.
roughly vertical “tail” (with length in millimeters and 3.1.1 Sharpen
diameter in micrometers to nanometers) which deforms
primarily by severe electrostatic force stretching and In sharpen, a constant (>1) is added to the transfer function
a helical “coil” in which the deformation is dominated of high-pass filters in the frequency domain to recall
by bending and twisting. Once these coiled fibers are some low-frequency components. This can improve the
dispersed along the stage moving direction, versatile contrast of the edge region and keep the smooth region at
structures can be formed on the substrate as shown in the same time . After sharpening, the observed region
[11]
Figure 2C. becomes easier to be detected than that of the original
image as shown in the first column of Table 1.
3. Image Processing and Feature Extraction
3.1.2 Maximum Connected Region
Various Taylor cones and jets images are recorded. The
next step is to process these images automatically and When color images are transformed into binary images,
construct the linkage between the diversity of Taylor there are numerous connected regions. As shown in
cones and deposited fibers. Image quality and size may the second column of Table 1, it consists of one major
A B
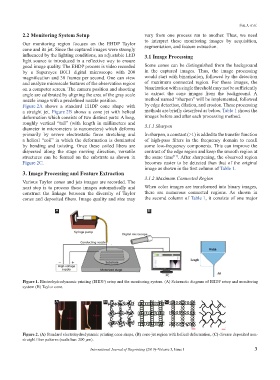
Figure 1. Electrohydrodynamic printing (EHDP) setup and the monitoring system. (A) Schematic diagram of EHDP setup and monitoring
system (B) Taylor cone.
A B C
Figure 2. (A) Standard electrohydrodynamic printing cone shape, (B) cone-jet region with helical deformation, (C) diverse deposited non-
straight fiber patterns (scale bar: 200 μm).
International Journal of Bioprinting (2019)–Volume 5, Issue 1 3