
Page 108 - IJB-5-1
P. 108
Electrohydrodynamic printing process monitoring by microscopic image identification
on the properties of the inks (viscosity, surface tension, images, applying CNN in EHDP cone modes’ classification
and electrical conductivity), environmental factors and validating the performance of the developed CNN
(temperature and humidity), and other process parameters models are presented in Section 4, and Section 5 provides
(nozzle-to-substrate distance, solution feeding rate, and concluding remarks and future directions.
dimensions of nozzle). Due to the process complexity
and the variation of electric field strength in fiber layer 2. Experimental setup
stacking process, EHDP lacks an accurate process model
and easily becomes unstable in large-scale fabrication 2.1. Introduction of EHDP system
(a few hours). Therefore, it becomes an urgent and, at the
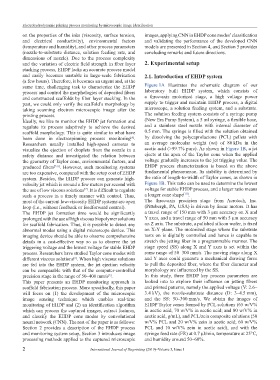
same time, challenging task to characterize the EHDP Figure 1A illustrates the schematic diagram of our
process and control the morphologies of deposited fibers laboratory built EHDP system, which consists of
and constructed scaffolds by fiber layer stacking. In the a three-axis motorized stage, a high voltage power
past, we could only verify the scaffold’s morphology by supply to trigger and maintain EHDP process, a digital
taking scanning electron microscopic image after the microscope, a solution feeding system, and a substrate.
printing process. The solution feeding system consists of a syringe pump
Ideally, we like to monitor the EHDP jet formation and (New Era Pump System), a 5 ml syringe, a flexible hose,
regulate its process adaptively to achieve the desired and a stainless steel nozzle with internal diameter of
scaffold morphology. This is quite similar to what have 0.5 mm. The syringe is filled with the solution obtained
been done in electrospinning process monitoring . by dissolving the polycaprolactone (PCL) pellets with
[4]
Researchers usually installed high-speed cameras to an average molecular weight (wt) of 80 kDa in the
visualize the ejection of droplets from the nozzle in a acetic acid (>99.7% pure). As shown in Figure 1B, a jet
safety distance and investigated the relation between ejects at the apex of the Taylor cone when the applied
the geometry of Taylor cone, environmental factors, and voltage gradually increases to the jet trigging value. The
produced fibers [5,6] . However, such monitoring systems EHDP process characterization is based on the above
are too expensive, compared with the setup cost of EHDP fundamental phenomenon. Its stability is determined by
system. Besides, the EHDP process can generate high- the ratio of length-to-width of Taylor cones, as shown in
velocity jet which is around a few meters per second with Figure 1B. This ratio can be used to determine the lowest
the use of low viscous solutions . It is difficult to regulate voltage for stable EHDP process, and a larger ratio means
[7]
[10]
such a process in a timely manner with control. Thus, a longer cone shape .
most of the current low-viscosity EHDP systems are open The three-axis precision stage from Aerotech, Inc.
loop (i.e., without feedback or feedforward control). (Pittsburgh, PA, USA) is driven by linear motors. It has
The EHDP jet formation time would be significantly a travel range of 150 mm with 3 μm accuracy on X and
prolonged with the use of high viscous biopolymer solutions Y axes, and a travel range of 50 mm with 5 μm accuracy
for scaffold fabrication. Thus, it is possible to detect any on Z axis. The substrate, a polished silicon wafer, is fixed
abnormal modes using a digital microscope device. This on X-Y plane. The motorized stage where the substrate
imaging device should be able to observe comprehensive rests on is digitally controlled and hence is capable to
details in a cost-effective way so as to observe the jet stretch the jetting fiber in a programmable manner. The
triggering voltage and the lowest voltage for stable EHDP stage speed (SS) along X and Y axes is set within the
process. Researchers have studied Taylor cone modes with same range of 50–300 mm/s. The moving stage along X
different viscous solutions . When high viscous solutions and Y axes could generate a mechanical drawing force
[8]
are fed into the EHDP system, the jet ejection velocity to pull the deposited fiber, where the fiber diameter and
can be comparable with that of the computer-controlled morphology are influenced by the SS.
precision stage in the range of 50–400 mm/s . In this study, three EHDP key process parameters are
[9]
This paper presents an EHDP monitoring approach in looked into to explore their influence on jetting fibers
scaffold fabrication process. More specifically, this paper and printed patterns, namely the applied voltage (V: 2.6–
will focus on (1) the development of the microscopic 3.4 kV), the nozzle-substrate distance (D: 3–4.5 mm),
image sensing technique which enables real-time and the SS: 50–300 mm/s. We obtain the images of
monitoring of EHDP and (2) an identification algorithm EHDP Taylor cones formed by PCL solutions (65 w/V%
which can process the captured images, extract features, in acetic acid; 70 w/V% in acetic acid; and 80 w/V% in
and classify the EHDP cone modes by convolutional acetic acid, g/mL), and PCL/zein composite solutions (50
neural network (CNN). The rest of the paper is as follows: w/V% PCL and 20 w/V% zein in acetic acid; 60 w/V%
Section 2 provides a description of the EHDP process PCL and 10 w/V% zein in acetic acid), and with the
and monitoring system setup, Section 3 introduces image syringe feed rate (FR) at 0.7 μl/min, temperature at 25°C,
processing methods applied to the captured microscopic and humidity around 50–60%.
2 International Journal of Bioprinting (2019)–Volume 5, Issue 1