
Page 58 - IJB-5-1
P. 58
Mechanisms and modeling of electrohydrodynamic phenomena
within 10%) for each simulation . cone is formed, and with further increase of field strength,
[32]
The Taylor angle (θ =49.3 ) is theoretically calculated the cone becomes unstable and then a small droplet or a
o
T
from the balance of surface-tension stress and electric very thin jet (small and thin compared with the capillary
stress under no fluid motion (hydrostatic pressure P, as diameter) is emitted from the conical apex . Juraschek
[17]
shown above, equal to zero) . Thus, the critical voltage, and Rollgen classified spray of axisymmetric regimes
[33]
which Taylor predicted, is only valid in the limit of no into three modes, based on current measurements [19,20] .
liquid jet emission and it does not account for any EHD With the increase of voltage, a pulsating jet (axial mode
effect caused by subsequent jet emission . The semi- I) appears, with pulsations frequencies existing in the low
[38]
vertical angle, which Taylor predicted above, is not kilohertz range or less . Marginean considered axial
[20]
always 49.3° and Fernandez de la Mora showed that mode I, which exhibits two periods, as burst regimen .
[19]
several factors, including liquid loss through the cone, As the voltage grows to the axial mode II, only high-
space charge, flow rate, and ambient pressure, might frequency pulsation at the low kilohertz is observed .
[20]
result in cones established at different semi-vertical The intrinsic or natural pulsating modes are caused by
angles [19,43-45] . Cloupeau and Prunet-Foch also showed an imbalance between the supply and loss of liquid in
that there are stable conical menisci for certain range the entire cone volume (low frequencies) or the cone’s
of variation in the hydrostatic pressure and applied apex (high frequencies) [20,28,48] . Juraschek and Rollgen
potential difference, but the value of the angle at the apex claimed that capillary current is linearly dependent on
is variable, and the generatrix of the cone may be either the pulsation frequency and independent of the capillary
concave or convex [18,40] . In addition, the actual electrode potential applied in the high pulsation mode . Chen et al.
[20]
setup in experiments may not replicate the geometry of observed steady-state results from a long exposure time
Taylor’s model . (0.4 ms), but the intrinsic pulsating mode in the kilohertz
[32]
In a word, it is important to obtain starting electric range was observed when the exposure time is reduced
potential for initiation of EHD printing, and equations (3, to 0.1 ms or less . Marginean et al., first, used a set
[28]
4) are used to estimate the critical value of the voltage. of sequential images (Figure 2B) to show spontaneous
The semi-vertical angle from experiments can be different Taylor cone deformation and a similar intrinsic pulsation
from Taylor angle applied to these equations, and this is at 1μs per frame . Figure 2B clearly shows periodic
[14]
a reason to cause a discrepancy between theoretical and formation, relaxation of meniscus, and cone-jet, and
experimental critical voltage. Another reason arises from they provide a direct connection between Taylor cone
factors which are not counted in equations, such as space pulsation and electrospray current oscillations [14,28] .
charge and shape of nozzle. Yogi et al. used an external stimuli method to generate
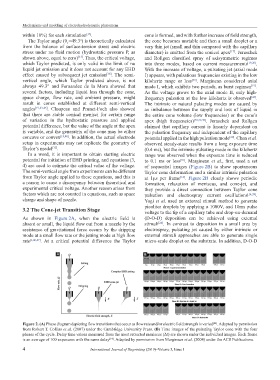
3.2 The Cone-jet Transition Stage picoliter droplets by applying a 1000V, and 10ms pulse
voltage to the tip of a capillary tube and drop-on-demand
As shown in Figure 2A, when the electric field is (D-O-D) deposition can be achieved using external
absent or small, the liquid flow out from a nozzle by the stimuli . In contrast to deposition in a small area by
[24]
assistance of gravitational force occurs by the dripping electrospray, pulsating jet caused by either intrinsic or
mode at a small flow rate or the jetting mode at high flow external stimuli approaches are able to generate single
rate [1,46,47] . At a critical potential difference the Taylor micro-scale droplet on the substrate. In addition, D-O-D
A B
Figure 2. (A) Phase diagram depicting flow transitions that occur as flow rate and/or electric field strength is varied . Adapted by permission
[46]
from Robert T. Collins et al. (2007) under the Cambridge University Press. (B) Time images of the pulsating Taylor cone with the four
phases of the cycle. Delay time values measured from the most retracted meniscus (Δt) are shown under the individual images. Each frame
is an average of 100 exposures with the same delay . Adapted by permission from Marginean et al. (2004) under the ACS Publications.
[14]
4 International Journal of Bioprinting (2019)–Volume 5, Issue 1