
Page 117 - IJB-5-2
P. 117
Ghalayini S, et al.
A B
Figure 4. Plots of the number percent of (A) CH-01 and (B) CH-02 nanoparticles at a range of sizes obtained through dynamic light
scattering.
A B C D
E F G H
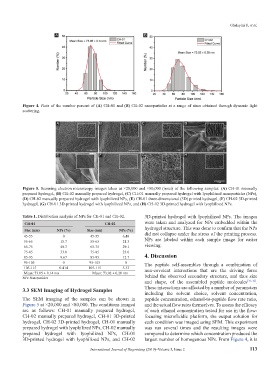
Figure 5. Scanning electron microscopy images taken at ×20,000 and ×80,000 (inset) of the following samples: (A) CH-01 manually
prepared hydrogel, (B) CH-02 manually prepared hydrogel, (C) CH-01 manually prepared hydrogel with lyophilized nanoparticles (NPs),
(D) CH-02 manually prepared hydrogel with lyophilized NPs, (E) CH-01 three-dimensional (3D) printed hydrogel, (F) CH-02 3D-printed
hydrogel, (G) CH-01 3D-printed hydrogel with lyophilized NPs, and (H) CH-02 3D-printed hydrogel with lyophilized NPs.
Table 1. Distribution analysis of NPs for CH-01 and CH-02. 3D-printed hydrogel with lyophilized NPs. The images
CH‑01 CH‑02 were taken and analyzed for NPs embedded within the
Size (nm) NPs (%) Size (nm) NPs (%) hydrogel structure. This was done to confirm that the NPs
45-55 0 45-55 6.48 did not collapse under the stress of the printing process.
55-65 15.7 55-65 21.3 NPs are labeled within each sample image for easier
65-75 40.3 65-75 29.1 viewing.
75-85 33.8 75-85 23.0
85-95 9.67 85-95 12.7 4. Discussion
95-105 0 95-105 0 The peptide self-assembles through a combination of
105-115 0.414 105-115 5.33 non-covalent interactions that are the driving force
Mean: 73.05 ± 0.14 nm Mean: 73.02 ± 0.20 nm
NPs: Nanoparticles behind the observed secondary structure, and thus size
and shape, of the assembled peptide molecules [31-36] .
3.3 SEM Imaging of Hydrogel Samples These interactions are affected by a number of parameters
including the solvent choice, solvent concentration,
The SEM imaging of the samples can be shown in peptide concentration, ethanol-to-peptide flow rate ratio,
Figure 5 at ×20,000 and ×80,000. The conditions imaged and the actual flow rates themselves. To assess the efficacy
are as follows: CH-01 manually prepared hydrogel, of each ethanol concentration tested for use in the flow-
CH-02 manually prepared hydrogel, CH-01 3D-printed focusing microfluidic platform, the output solution for
hydrogel, CH-02 3D-printed hydrogel, CH-01 manually each condition was imaged using SEM. This experiment
prepared hydrogel with lyophilized NPs, CH-02 manually was run several times and the resulting images were
prepared hydrogel with lyophilized NPs, CH-01 compared to determine which concentration produced the
3D-printed hydrogel with lyophilized NPs, and CH-02 largest number of homogenous NPs. From Figure 4, it is
International Journal of Bioprinting (2019)–Volume 5, Issue 2 113