
Page 116 - IJB-5-2
P. 116
Preparation and printability of ultrashort self-assembling peptide nanoparticles
2.4 Scanning Electron Microscopy (SEM) A D
Characterization of the Peptide NPs
During the optimization process, the peptide NPs were
characterized using SEM to visualize the morphology
and size distribution of the particles. Samples were
prepared on SEM silicon wafers polished with acetone
and isopropanol before drying with KimWipes and
nitrogen gas. The silicon wafers were placed on double-
stick conductive carbon tape attached to the SEM B E
aluminum pin stub. The collected NP solutions were
vortexed briefly before pipetting 15 µL of solution onto
the silicon wafer. Prepared samples were left overnight
to dry in a vacuum desiccator, then sputter coated with
a 5 nm thickness of iridium before imaging. Images
were taken with FEI Magellan XHR and FEI Quanta
600 FEG.
2.5 SEM Characterization of the Peptide C F
Hydrogels
The peptide NPs were characterized using SEM to
visualize the morphology of the NPs. This was done for
samples with NPs that were printed and made manually,
as well as for samples with NPs straight from the ethanol
solution and those that were lyophilized to compare
the integrity of the NPs. As the samples were printed
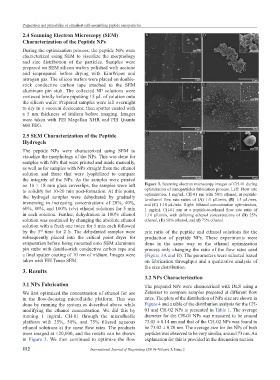
on 18 × 18 mm glass coverslips, the samples were left Figure 3. Scanning electron microscopy images of CH-01 during
to solidify for 10-20 min post-formation. At this point, optimization of nanoparticles fabrication process. Left: Flow rate
optimization, 1 mg/mL CH-01 run with 50% ethanol, at peptide-
the hydrogel samples were dehydrated by gradually to-ethanol flow rate ratios of (A) 1:1 µL/min, (B) 1:5 µL/min,
immersing in increasing concentrations of 20%, 40%, and (C) 1:10 µL/min. Right: Ethanol concentration optimization,
60%, 80%, and 100% (v/v) ethanol solutions for 5 min 1 mg/mL CH-01 run at a peptide-to-ethanol flow rate ratio of
in each solution. Further, dehydration in 100% ethanol 1:10 µL/min, with differing ethanol concentrations of (D) 25%
solution was continued by changing the absolute ethanol ethanol, (E) 50% ethanol, and (f) 75% ethanol.
solution with a fresh one twice for 5 min each followed
by the 3 time for 2 h. The dehydrated samples were rate ratio of the peptide and ethanol solutions for the
rd
subsequently placed into the critical point dryer for production of peptide NPs. These experiments were
evaporation before being mounted onto SEM aluminum done in the same way as the ethanol optimization
pin stubs with double-stick conductive carbon tape and process only changing the ratio of the flow rates used
a final sputter coating of 10 nm of iridium. Images were (Figure 3A and B). The parameters were selected based
taken with FEI Teneo SEM. on fabrication throughput and a qualitative analysis of
the size distribution.
3. Results
3.2 NPs Characterization
3.1 NPs Fabrication The prepared NPs were characterized with DLS using a
We first optimized the concentration of ethanol for use Zetasizer to compare samples prepared at different flow
in the flow-focusing microfluidic platform. This was rates. The plots of the distribution of NPs size are shown in
done by running the system as described above while Figure 4 and a table of the distribution analysis for the CH-
modifying the ethanol concentration. We did this by 01 and CH-02 NPs is presented in Table 1. The average
running 1 mg/mL CH-01 through the microfluidic diameter for the CH-01 NPs was measured to be around
platform with 25%, 50%, and 75% filtered aqueous 73.05 ± 0.14 nm and that of the CH-02 NPs was found to
ethanol solutions at the same flow rates. The products be 73.02 ± 0.20 nm. The average size for the NPs of both
were imaged at ×20,000, and the results can be shown peptides was observed to be very similar, around 73 nm. An
in Figure 3. We then continued to optimize the flow explanation for this is provided in the discussion section.
112 International Journal of Bioprinting (2019)–Volume 5, Issue 2