
Page 115 - IJB-5-2
P. 115
Ghalayini S, et al.
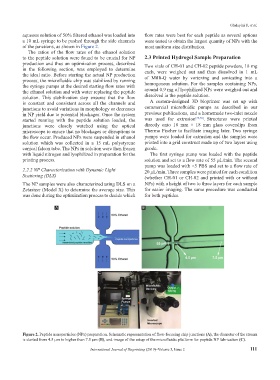
aqueous solution of 50% filtered ethanol was loaded into flow rates were best for each peptide as several options
a 10 mL syringe to be pushed through the side channels were tested to obtain the largest quantity of NPs with the
of the junctions, as shown in Figure 2. most uniform size distribution.
The ratios of the flow rates of the ethanol solution
to the peptide solution were found to be crucial for NP 2.3 Printed Hydrogel Sample Preparation
production and thus an optimization process, described Two vials of CH-01 and CH-02 peptide powders, 18 mg
in the following section, was employed to determine each, were weighed out and then dissolved in 1 mL
the ideal ratio. Before starting the actual NP production
process, the microfluidic chip was stabilized by running of Milli-Q water by vortexing and sonicating into a
homogenous solution. For the samples containing NPs,
the syringe pumps at the desired starting flow rates with
the ethanol solution and with water replacing the peptide around 0.9 mg of lyophilized NPs were weighed out and
solution. This stabilization step ensures that the flow dissolved in the peptide solution.
is constant and consistent across all the channels and A custom-designed 3D bioprinter was set up with
junctions to avoid variations in morphology or decreases commercial microfluidic pumps as described in our
in NP yield due to potential blockages. Once the system previous publications, and a homemade two-inlet nozzle
started running with the peptide solution loaded, the was used for extrusion [29,30] . Structures were printed
junctions were closely watched using the optical directly onto 18 mm × 18 mm glass coverslips from
microscope to ensure that no blockages or disruptions to Thermo Fischer to facilitate imaging later. Two syringe
the flow occur. Produced NPs were suspended in ethanol pumps were loaded for extrusion and the samples were
solution which was collected in a 15 mL polystyrene printed into a grid construct made up of two layers using
conical falcon tube. The NPs in solution were then frozen gcode.
with liquid nitrogen and lyophilized in preparation for the The first syringe pump was loaded with the peptide
printing process. solution and set to a flow rate of 55 µL/min. The second
pump was loaded with ×5 PBS and set to a flow rate of
2.2.2 NP Characterization with Dynamic Light 20 µL/min. Three samples were printed for each condition
Scattering (DLS) (whether CH-01 or CH-02 and printed with or without
The NP samples were also characterized using DLS on a NPs) with a height of two to three layers for each sample
Zetasizer (Model X) to determine the average size. This for easier imaging. The same procedure was conducted
was done during the optimization process to decide which for both peptides.
A B
C
Figure 2. Peptide nanoparticles (NPs) preparation. Schematic representation of flow-focusing chip junctions (A), the diameter of the stream
is started from 4.5 μm to higher than 7.5 μm (B), and image of the setup of the microfluidic platform for peptide NP fabrication (C).
International Journal of Bioprinting (2019)–Volume 5, Issue 2 111