
Page 267 - IJB-10-5
P. 267
International Journal of Bioprinting A TPMS framework for complete dentures
size but also directly affects various mechanical properties, Therefore should be restricted to [ω / 0.183· t, 0.9],
min
including yield strength and flexural strength. By where ω generally refers to the minimum printable
37
min
adjusting parameter c (i.e., controlling wall thickness), the thickness. Taking into account the practical conditions of
relative density can be precisely adjusted. The approximate the manufacturing equipment, assuming ω min ≥ 0.15mm,
linear relationship between the parameter c and the relative the relationship between c and t can be expressed as:
density ρ is as follows:
t min ∙ c min ≥0.82 (IV)
ρ = 66.1c (II)
For ease of subsequent calculations and to demonstrate
gradient variation, we set c min = 0.45 and t min = 2. Within
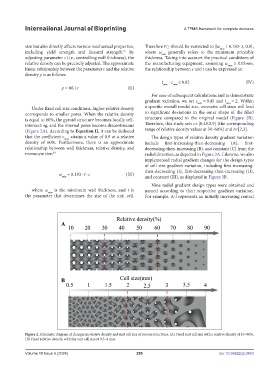
Under fixed cell size conditions, higher relative density a specific overall model size, excessive cell sizes will lead
corresponds to smaller pores. When the relative density to significant deviations in the outer shape of the filled
is equal to 60%, the gyroid structure becomes locally self- structure compared to the original model (Figure 2B).
intersecting, and the internal pores become discontinuous Therefore, this study sets c∈[0.45,0.9] (the corresponding
(Figure 2A). According to Equation II, it can be deduced range of relative density values at 30–60%) and t∈[2,3].
that the coefficient c max attains a value of 0.9 at a relative The design types of relative density gradient variation
density of 60%. Furthermore, there is an approximate include first-increasing-then-decreasing (A), first-
relationship between wall thickness, relative density, and decreasing-then-increasing (B), and constant (C) from the
monocyte size: 38 radial direction, as depicted in Figure 3A. Likewise, we also
implemented radial gradient changes for the design types
of cell size gradient variation, including first-increasing-
then-decreasing (I), first-decreasing-then-increasing (II),
ω ≈ 0.183 . t . c (III) and constant (III), as displayed in Figure 3B.
min
Nine radial gradient design types were obtained and
where ω is the minimum wall thickness, and t is named according to their respective gradient variation.
min
the parameter that determines the size of the unit cell. For example, A-I represents an initially increasing central
Figure 2. Schematic diagram of changes in relative density and unit cell size of porous structures. (A) Fixed unit cell size with a relative density of 10–90%.
(B) Fixed relative density, with the unit cell size at 0.5–4 mm.
Volume 10 Issue 5 (2024) 259 doi: 10.36922/ijb.3453