
Page 338 - IJB-10-5
P. 338
International Journal of Bioprinting Immunomodulatory bone repair by MBG/PCL
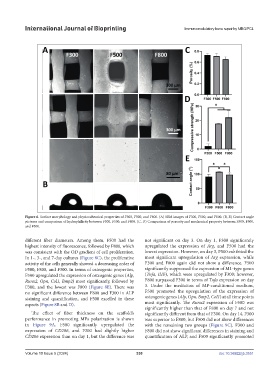
Figure 6. Surface morphology and physicochemical properties of F300, F500, and F800. (A) SEM images of F300, F500, and F800. (B, E) Contact angle
pictures and comparison of hydrophilicity between F300, F500, and F800. (C, D) Comparison of porosity and mechanical property between F300, F500,
and F800.
different fiber diameters. Among them, F500 had the not significant on day 3. On day 1, F300 significantly
highest intensity of fluorescence, followed by F800, which upregulated the expression of Arg, and F500 had the
was consistent with the OD gradient of cell proliferation. lowest expression. However, on day 3, F500 exhibited the
In 1-, 3-, and 7-day cultures (Figure 8C), the proliferative most significant upregulation of Arg expression, while
activity of the cells generally showed a decreasing order of F300 and F800 again did not show a difference. F500
F500, F800, and F300. In terms of osteogenic properties, significantly suppressed the expression of M1-type genes
F500 upregulated the expression of osteogenic genes (Alp, (Tnfa, Il1b), which were upregulated by F300; however,
Runx2, Opn, Col1, Bmp2) most significantly, followed by F800 surpassed F300 in terms of Tnfa expression on day
F300, and the lowest was F800 (Figure 8E). There was 3. Under the mediation of MP-conditioned medium,
no significant difference between F800 and F300 in ALP F500 promoted the upregulation of the expression of
staining and quantification, and F500 excelled in these osteogenic genes (Alp, Opn, Bmp2, Col1) at all time points
aspects (Figure 8B and D). most significantly. The Runx2 expression of F500 was
significantly higher than that of F800 on day 7 and not
The effect of fiber thickness on the scaffold’s significantly different from that of F300. On day 14, F300
performance in promoting MPs polarization is shown was superior to F800, but F500 did not show differences
in Figure 9A. F500 significantly upregulated the with the remaining two groups (Figure 9C). F300 and
expression of CD206, and F300 had slightly higher F800 did not show significant differences in staining and
CD206 expression than on day 1, but the difference was quantification of ALP, and F500 significantly promoted
Volume 10 Issue 5 (2024) 330 doi: 10.36922/ijb.3551