
Page 458 - IJB-10-5
P. 458
International Journal of Bioprinting 3D-printed plasma devices for decontamination
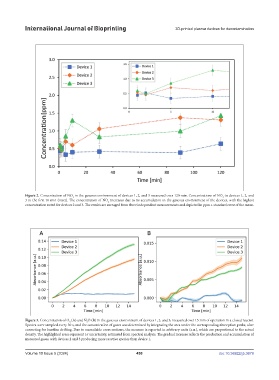
Figure 2. Concentration of NO in the gaseous environment of devices 1, 2, and 3 measured over 120 min. Concentrations of NO in devices 1, 2, and
2
2
3 in the first 10 min (inset). The concentration of NO increases due to its accumulation in the gaseous environment of the devices, with the highest
2
concentration noted for devices 2 and 3. The results are averaged from three independent measurements and depicted in ppm ± standard error of the mean.
Figure 3. Concentration of O (A) and N O (B) in the gaseous environment of devices 1, 2, and 3, measured over 15 min of operation in a closed reactor.
2
3
Spectra were sampled every 30 s, and the concentration of gases was determined by integrating the area under the corresponding absorption peaks, after
correcting for baseline drifting. Due to unavailable cross sections, the measure is reported in arbitrary units (a.u.), which are proportional to the actual
density. The highlighted areas represent 1σ uncertainty, estimated from spectral analysis. The gradual increase reflects the production and accumulation of
measured gases, with devices 2 and 3 producing more reactive species than device 1.
Volume 10 Issue 5 (2024) 450 doi: 10.36922/ijb.3679