
Page 460 - IJB-10-5
P. 460
International Journal of Bioprinting 3D-printed plasma devices for decontamination
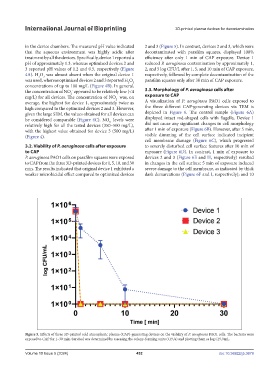
in the device chambers. The measured pH value indicated 2 and 3 (Figure 5). In contrast, devices 2 and 3, which were
that the aqueous environment was highly acidic after decontaminated with parafilm squares, displayed 100%
treatment by all the devices. Specifically, device 1 reported a efficiency after only 1 min of CAP exposure. Device 1
pH of approximately 1.3, whereas optimized devices 2 and reduced P. aeruginosa contamination by approximately 1,
3 reported pH values of 1.2 and 0.5, respectively (Figure 2, and 5 log CFU/L after 1, 5, and 10 min of CAP exposure,
4A). H O was almost absent when the original device 1 respectively, followed by complete decontamination of the
2
2
was used, whereas optimized devices 2 and 3 reported H O parafilm squares only after 30 min of CAP exposure.
2
2
concentrations of up to 100 mg/L (Figure 4B). In general,
the concentration of NO appeared to be relatively low (<4 3.3. Morphology of P. aeruginosa cells after
-
2
mg/L) for all devices. The concentration of NO was, on exposure to CAP
-
2
average, the highest for device 1, approximately twice as A visualization of P. aeruginosa PAO1 cells exposed to
high compared to the optimized devices 2 and 3. However, the three different CAP-generating devices via TEM is
given the large SEM, the values obtained for all devices can depicted in Figure 6. The control sample (Figure 6A)
be considered comparable (Figure 4C). NO levels were displayed intact rod-shaped cells with flagella. Device 1
-
3
relatively high for all the tested devices (350–500 mg/L), did not cause any significant changes in cell morphology
with the highest value obtained for device 3 (500 mg/L) after 1 min of exposure (Figure 6B). However, after 5 min,
(Figure 4). visible dimming of the cell surface indicated incipient
cell membrane damage (Figure 6C), which progressed
3.2. Viability of P. aeruginosa cells after exposure to severely disturbed cell surface features after 10 min of
to CAP exposure (Figure 6D). In contrast, 1 min of exposure to
P. aeruginosa PAO1 cells on parafilm squares were exposed devices 2 and 3 (Figure 6E and H, respectively) resulted
to CAP from the three 3D-printed devices for 1, 5, 10, and 30 in changes in the cell surface; 5 min of exposure induced
min. The results indicated that original device 1 exhibited a severe damage to the cell membrane, as indicated by thick
weaker microbicidal effect compared to optimized devices dark demarcations (Figure 6F and I, respectively); and 10
Figure 5. Effects of three 3D-printed cold atmospheric plasma (CAP)-generating devices on the viability of P. aeruginosa PAO1 cells. The bacteria were
exposed to CAP for 1–30 min. Survival was determined by assessing the colony-forming units (CFUs) and plotting them as log CFU/mL.
Volume 10 Issue 5 (2024) 452 doi: 10.36922/ijb.3679