
Page 559 - IJB-10-5
P. 559
International Journal of Bioprinting 3D bioprinting of collagen hydrogels
measuring 1.00 ± 0.05 mm, consistent with the grid model higher than the G˝ within the frequency range of 1–100
size. The structure exhibited a well-defined mesh with rad/s (Figure 4D). The CML-scaffold exhibited minimal
interconnected pores, and the average pore size was 33.28 variations in Gʹ across different frequencies, indicating
± 7.57 μm (Figure S2, Supporting Information). its ability to maintain a stable gel state under both short-
Rheological testing was performed to investigate the and long-timescale stress. In contrast, the strength of
mechanical characteristics of Col and the CML-scaffold. Col was notably influenced by the timescale, suggesting
The amplitude scan curves revealed that the CML-scaffold temporal sensitivity. Consequently, the mechanical
exhibited a wider linear viscoelastic region (LVR) compared strength of Col was significantly lower compared to that of
to Col, with Gʹ being higher than Col’s Gʹ at both LVRs. At the CML-scaffold.
a strain of 1%, the CML-scaffold had a Gʹ of 3974 Pa, while Compression tests were conducted on Col and the CML-
Col had a Gʹ of 467 Pa (Figure 4C). The results indicate scaffold to further assess changes in mechanical strength.
that both Col and the CML-scaffold exhibit a viscoelastic The compressive stress–strain curves revealed that when
solid state within the LVR range, with the CML-scaffold the strain of the CML-scaffold reached 44.99%, its ultimate
notably possessing significantly higher hardness than fracture strength was 216.68 kPa, while the compressive
Col. The frequency scan curves revealed that the Gʹ of strength of Col under this strain was 4.21 kPa (Figure 4E).
both Col and the CML-scaffold remained consistently In the elastic phase (0–20%), the compressive moduli were
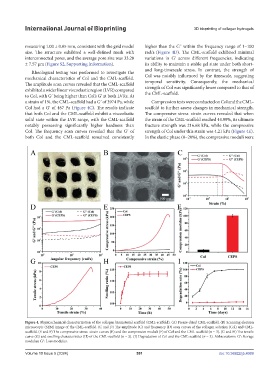
Figure 4. Physicochemical characterization of the collagen biomaterial scaffold (CML-scaffold). (A) Freeze-dried CML-scaffold. (B) Scanning electron
microscopic (SEM) image of the CML-scaffold. (C and D) The amplitude (C) and frequency (D) scan curves of the collagen solution (Col) and CML-
scaffold. (E and F) The compressive stress–strain curves (E) and the compressive moduli (F) of Col and the CML-scaffold (n = 3). (G and H) The tensile
curve (G) and swelling characteristics (H) of the CML-scaffold (n = 3). (I) Degradation of Col and the CML-scaffold (n = 3). Abbreviations: Gʹ: Storage
modulus; G˝: Loss modulus.
Volume 10 Issue 5 (2024) 551 doi: 10.36922/ijb.4069