
Page 570 - IJB-10-5
P. 570
International Journal of Bioprinting ML-generated GelMA compression database
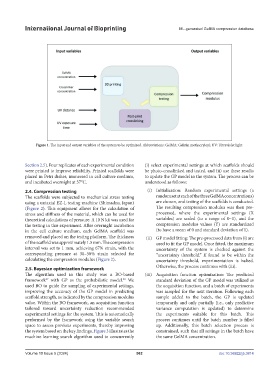
Figure 1. The input and output variables of the system to be optimized. Abbreviations: GelMA: Gelatin methacryloyl; UV: Ultraviolet light.
Section 2.5). Four replicates of each experimental condition (i) select experimental settings at which scaffolds should
were printed to improve reliability. Printed scaffolds were be photo-crosslinked and tested, and (ii) use these results
placed in Petri dishes, immersed in cell culture medium, to update the GP model in the system. The process can be
and incubated overnight at 37°C. understood as follows:
2.4. Compression testing (i) Initialization: Random experimental settings (a
The scaffolds were subjected to mechanical stress testing random set at each of the three GelMA concentrations)
using a uniaxial EZ-L testing machine (Shimadzu, Japan) are chosen, and testing of the scaffolds is conducted.
(Figure 2). This equipment allows for the calculation of The resulting compression modulus was then pre-
stress and stiffness of the material, which can be used for processed, where the experimental settings (X
theoretical calculations of pressure. A 10 N kit was used for variables) are scaled (to a range of 0–1), and the
the testing in this experiment. After overnight incubation compression modulus values (Y) are standardized
in the cell culture medium, each GelMA scaffold was (to have a mean of 0 and standard deviation of 1).
removed and placed on the testing platform. The thickness (ii) GP model fitting: The pre-processed data from (i) are
of the scaffold was approximately 1.5 mm. The compression used to fit the GP model. Once fitted, the maximum
interval was set to 1 mm, achieving 67% strain, with the uncertainty of the system is checked against the
corresponding pressure at 30–50% strain selected for “uncertainty threshold.” If found to be within the
calculating the compression modulus (Figure 2). uncertainty threshold, experimentation is halted.
Otherwise, the process continues with (iii).
2.5. Bayesian optimization framework
The algorithm used in this study was a BO-based (iii) Acquisition function optimization: The predicted
27
framework with GP as the probabilistic model. We standard deviation of the GP model was utilized as
28
used BO to guide the sampling of experimental settings, the acquisition function, and a batch of experiments
improving the accuracy of the GP model in predicting was sampled for the next iteration. Following each
scaffold strength, as indicated by the compression modulus sample added to the batch, the GP is updated
value. Within the BO framework, an acquisition function temporarily and only partially (i.e., only predictive
tailored toward uncertainty reduction recommended variance computation is updated) to determine
experimental settings for the system. This is automatically the experiments suitable for this batch. This
performed by the framework using the variable search process continues until the batch number is filled
space to assess previous experiments, thereby improving up. Additionally, this batch selection process is
the system based on the key findings. Figure 3 illustrates the constrained, such that all settings in the batch have
machine learning search algorithm used to concurrently the same GelMA concentration.
Volume 10 Issue 5 (2024) 562 doi: 10.36922/ijb.3814