Page 573 - IJB-10-5
P. 573
International Journal of Bioprinting                             ML-generated GelMA compression database


                         k
                     k    x , x   k   x    t 1 ,  x    3.2. Maximum uncertainty

                                              t
                                1
                              t 1
                                                               Sampling was stopped when at least 90% of the GP
                                                               model’s prediction had a standard deviation within the
            2.5.3. Acquisition function                        user-specified threshold of 40 kPa. This was determined
            An acquisition function is optimized to select the next   by  predicting  the  standard deviation  at  each  of  the
            experimental settings. As our study focuses on reducing   experimental settings. Figure 5 features the percentage of
            the epistemic (predictive) uncertainty in the GP model,   points, at each iteration, which have a predicted standard
            our acquisition function refers to the predicted standard   deviation within 40 kPa. Experimentation ceased after
            deviation of the GP.                               iteration 10 when the percentage of points meeting this
                                                               criterion reached 91.3% (Figure A2). Figure 6 presents the
            2.5.4. Constrained batch sampling                  maximum standard deviation within the system. This plot
            When filling the batch of up to 10 experimental settings   illustrates the changes in overall uncertainty and highlights
            for the next iteration, the first point of the batch is   the reduction in uncertainty in the most uncertain areas
            determined by optimizing the acquisition function from   of the search space. Figure 7 displays the distribution of
            the usual GP (Figure A1). After selecting this point, all   the predicted standard deviation at iteration 10  when
            experimental points in the batch (initially 1) are used   experimentation ended. By  then,  91.3%  of points in  the
            to update the predicted standard deviation (Equation   search space were below the 40 kPa criteria, with the highest
            II) by fitting a temporary GP that updates its model for   uncertainty remaining within the system at 52.8 kPa.
            predictive variance.  The updated model of predictive
            variance is further optimized to determine the next   3.3. Length scale of experimental variables
            experimental setting for the batch. This process is   In  each  iteration, a  new  GP  model  is  fitted  based  on
            continued (using all points in the batch so far) until the   the latest data available. In doing so, the length scale
            batch is full.                                     hyperparameter is tuned via maximization of the log-
                                                               likelihood.  The length scale reflects the sensitivity of the
                                                                       28
            2.5.5. Manual values                               change in compression modulus values to changes in the
            In some instances, the experimental settings returned to   experimental variables. A larger length scale indicates a
            the experimenter resulted in scaffolds that disintegrated   system that is less sensitive to changes in the given variable,
            in the cell culture medium and the compression modulus   while a smaller length scale indicates greater sensitivity.
            could not be measured. In these situations, the compression   Our experiment consisted of respective constant length
            modulus value was manually coded as 0 before fitting the   scale values associated with each of the four experimental
            GP model.                                          variables. Figure 8 displays the adjusted length scale value
                                                               for each experimental variable at each iteration. In early
            3. Results                                         iterations, the limited data resulted in more fluctuations
            3.1. Scaffold printing optimization                in the length scales between iterations; in later iterations,
            The reservoir temperature was optimized for the GeSiM   when more data is available, more stable estimates can
            BioScaffolder to ensure a continuous filament was   be made. After iteration 8, the length scale was observed
            produced during bioink extrusion from the needle tip and   to  have  stabilized,  and  further  adjustments  were  not
            that square pores were  formed on  layer stacking  of the   made henceforth.
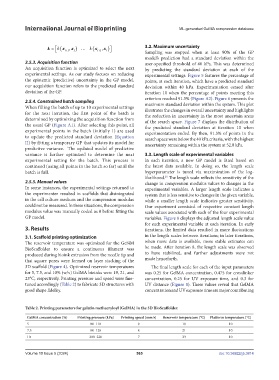
            3D scaffold (Figure 4). Optimized reservoir temperatures   The final length scale for each of the input parameters
            for 5, 7.5, and 10% (w/v) GelMA bioinks were 19, 21, and   was 0.25 for GelMA concentration, 0.475 for crosslinker
            23°C, respectively. Printing pressure and speed were fine-  concentration, 0.25 for UV exposure time, and 0.3 for
            tuned accordingly (Table 2) to fabricate 3D structures with   UV distance (Figure 8). These values reveal that GelMA
            good shape fidelity.                               concentration and UV exposure time are major contributing


            Table 2. Printing parameters for gelatin methacryloyl (GelMA) in the 3D BioScaffolder.

             GelMA concentration (%)  Printing pressure (kPa)  Printing speed (mm/s)  Reservoir temperature (°C)  Platform temperature (°C)
             5                         80–110               9                  19                  10
             7.5                       90–120               8                  21                  10
             10                        200–220              7                  23                  10


            Volume 10 Issue 5 (2024)                       565                                doi: 10.36922/ijb.3814

