
Page 571 - IJB-10-5
P. 571
International Journal of Bioprinting ML-generated GelMA compression database
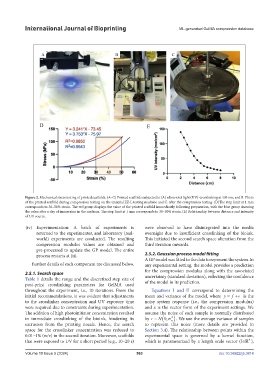
Figure 2. Mechanical stress testing of printed scaffolds. (A–C) Printed scaffolds subjected to (A) ultraviolet light (UV)-crosslinking at 405 nm; and B. Photo
of the printed scaffold during compression testing on the uniaxial EZ-L testing machine and C. after the compression testing. (D)The stop limit at 1 mm
corresponds to 30–50% strain. The red group displays the value of the printed scaffold immediately following preparation, with the blue group showing
the value after a day of immersion in the medium. The stop limit at 1 mm corresponds to 30–50% strain. (E) Relationship between distance and intensity
of UV source.
(iv) Experimentation: A batch of experiments is were observed to have disintegrated into the media
returned to the experimenter, and laboratory (real- overnight due to insufficient crosslinking of the bioink.
world) experiments are conducted. The resulting This initiated the second search space alteration from the
compression modulus values are obtained and third iteration onwards.
pre-processed to update the GP model. The entire
process restarts at (ii). 2.5.2. Gaussian process model fitting
A GP model was fitted to the data to represent the system. In
Further details of each component are discussed below. any experimental setting, the model provides a prediction
2.5.1. Search space for the compression modulus along with the associated
Table 1 details the range and the discretized step size of uncertainty (standard deviation), reflecting the confidence
post-print crosslinking parameters for GelMA used of the model in its prediction.
throughout the experiment, i.e., 10 iterations. From the Equations I and II correspond to determining the
initial recommendations, it was evident that adjustments mean and variance of the model, where y f is the
to the crosslinker concentration and UV exposure time noisy system response (i.e., the compression modulus)
were required due to constraints during experimentation. and x is the vector form of the experiment settings. We
The addition of high photoinitiator concentration resulted assume the noise of each sample is normally distributed
2
in immediate crosslinking of the bioink, hindering its by ϵ ~ N 0, . We use the average variance of samples
n
extrusion from the printing nozzle. Hence, the search to represent this noise (more details are provided in
space for the crosslinker concentration was reduced to Section 3.4). The relationship between points within the
0.01–1% (w/v) in the second iteration. Moreover, scaffolds experimental space is governed by a kernel function,
4
that were exposed to UV for a short period (e.g., 10–20 s) which is parameterized by a length scale vector (l∈�l ),
Volume 10 Issue 5 (2024) 563 doi: 10.36922/ijb.3814