
Page 574 - IJB-10-5
P. 574
International Journal of Bioprinting ML-generated GelMA compression database
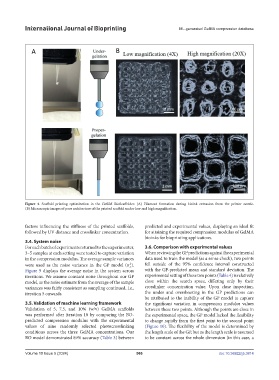
Figure 4. Scaffold printing optimization in the GeSiM BioScaffolder. (A) Filament formation during bioink extrusion from the printer nozzle.
(B) Microscopic images of pore architecture of the printed scaffold under low and high magnification.
factors influencing the stiffness of the printed scaffolds, predicted and experimental values, displaying an ideal fit
followed by UV distance and crosslinker concentration. for attaining the required compression modulus of GelMA
bioinks for bioprinting applications.
3.4. System noise
For each batch of experiments returned to the experimenter, 3.6. Comparison with experimental values
3–5 samples at each setting were tested to capture variation When reviewing the GP predictions against the experimental
in the compression modulus. The average sample variances data used to train the model (as a sense check), two points
were used as the noise variance in the GP model (σ ). fell outside of the 95% confidence interval constructed
2
n
Figure 9 displays the average noise in the system across with the GP-predicted mean and standard deviation. The
iterations. We assume constant noise throughout our GP experimental setting of these two points (Table 4) is relatively
model, as the noise estimate from the average of the sample close within the search space, differing only by their
variances was fairly consistent as sampling continued, i.e., crosslinker concentration value. Upon close inspection,
iteration 5 onwards. the under and overshooting in the GP predictions can
be attributed to the inability of the GP model to capture
3.5. Validation of machine learning framework the significant variation in compression modulus values
Validation of 5, 7.5, and 10% (w/v) GelMA scaffolds between these two points. Although the points are close in
was performed after iteration 10 by comparing the BO- the experimental space, the GP model lacked the flexibility
predicted compression modulus with the experimental to change rapidly from the first point to the second point
values of nine randomly selected photocrosslinking (Figure 10). The flexibility of the model is determined by
conditions across the three GelMA concentrations. Our the length scale of the GP, but as the length scale is assumed
BO model demonstrated 89% accuracy (Table 3) between to be constant across the whole dimension (in this case, a
Volume 10 Issue 5 (2024) 566 doi: 10.36922/ijb.3814