
Page 578 - IJB-10-5
P. 578
International Journal of Bioprinting ML-generated GelMA compression database
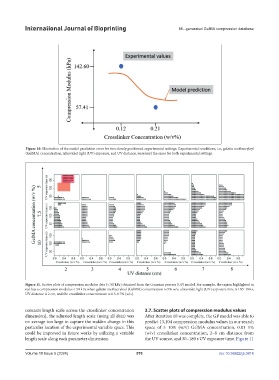
Figure 10. Illustration of the model prediction error for two closely positioned experimental settings. Experimental conditions, i.e., gelatin methacryloyl
(GelMA) concentration, ultraviolet light (UV) exposure, and UV distance, were kept the same for both experimental settings.
Figure 11. Scatter plots of compression modulus data (< 50 kPa) obtained from the Gaussian process (GP) model. For example, the region highlighted in
red has a compression modulus < 50 kPa when gelatin methacryloyl (GelMA) concentration is 5% w/v, ultraviolet light (UV) exposure time is 150–180 s,
UV distance is 2 cm, and the crosslinker concentration is 0.5-0.7% (w/v).
constant length scale across the crosslinker concentration 3.7. Scatter plots of compression modulus values
dimension), the adjusted length scale (using all data) was After iteration 10 was complete, the GP model was able to
on average too large to capture the sudden change in this predict 13,104 compression modulus values in our search
particular location of the experimental variable space. This space of 5–10% (w/v) GelMA concentration, 0.01–1%
could be improved in future works by utilizing a variable (w/v) crosslinker concentration, 2–8 cm distance from
length scale along each parameter dimension. the UV source, and 30–180 s UV exposure time. Figure 11
Volume 10 Issue 5 (2024) 570 doi: 10.36922/ijb.3814