
Page 577 - IJB-10-5
P. 577
International Journal of Bioprinting ML-generated GelMA compression database
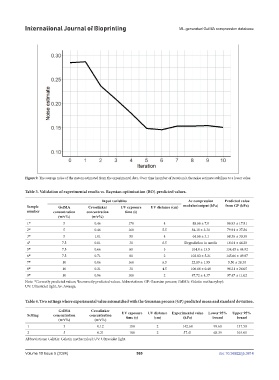
Figure 9. The average noise of the system estimated from the experimental data. Over time (number of iterations), the noise estimate stabilizes to a lower value.
Table 3. Validation of experimental results vs. Bayesian optimization (BO)-predicted values.
Input variables Av compression Predicted value
Sample GelMA Crosslinker UV exposure UV distance (cm) modulus/output (kPa) from GP (kPa)
number concentration concentration time (s)
(w/v%) (w/v%)
1* 5 0.46 170 4 88.66 ± 7.8 86.93 ± 17.81
2* 5 0.46 160 5.5 84.18 ± 3.31 79.91 ± 37.86
3* 5 1.01 50 4 64.66 ± 3.1 68.36 ± 30.30
4 # 7.5 0.01 30 6.5 Degradation in media 16.01 ± 46.20
5* 7.5 0.66 60 3 104.8 ± 13.5 134.45 ± 44.92
6* 7.5 0.71 80 2 102.83 ± 5.21 145.66 ± 49.87
7* 10 0.06 160 6.5 22.89 ± 1.55 5.50 ± 28.30
8* 10 0.21 30 4.5 106.66 ± 0.48 96.21 ± 26.05
9* 10 0.96 100 2 87.72 ± 4.37 97.47 ± 11.02
Note: *Correctly predicted values; Incorrectly predicted values. Abbreviations: GP: Gaussian process; GelMA: Gelatin methacryloyl;
#
UV: Ultraviolet light; Av: Average.
Table 4. Two settings where experimental value mismatched with the Gaussian process (GP) predicted mean and standard deviation.
GelMA Crosslinker
Setting concentration concentration UV exposure UV distance Experimental value Lower 95% Upper 95%
bound
bound
time (s)
(cm)
(kPa)
(w/v%) (w/v%)
1 5 0.12 180 2 142.60 99.68 137.50
2 5 0.21 180 2 57.41 68.39 103.01
Abbreviations: GelMA: Gelatin methacryloyl; UV: Ultraviolet light.
Volume 10 Issue 5 (2024) 569 doi: 10.36922/ijb.3814