
Page 576 - IJB-10-5
P. 576
International Journal of Bioprinting ML-generated GelMA compression database
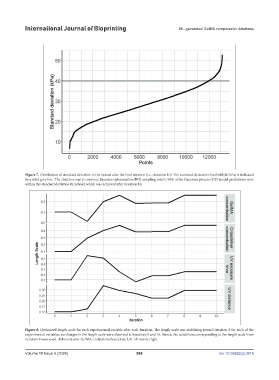
Figure 7. Distribution of standard deviation in the system after the final iteration (i.e., iteration 10). The standard deviation threshold (40 kPa) is indicated
by a solid grey line. The objective was to continue Bayesian optimization (BO) sampling until ≥ 90% of the Gaussian process (GP) model predictions were
within the standard deviation threshold, which was achieved after iteration 10.
Figure 8. Optimized length scale for each experimental variable after each iteration. The length scale was stabilizing toward iteration 8 for each of the
experimental variables; no changes in the length scale were observed at iterations 9 and 10. Hence, the conditions corresponding to the length scale from
iteration 8 were used. Abbreviations: GelMA: Gelatin methacryloyl; UV: Ultraviolet light.
Volume 10 Issue 5 (2024) 568 doi: 10.36922/ijb.3814