
Page 101 - IJB-6-1
P. 101
Shuai, et al.
3.3 Degradation properties soaking for 4 weeks, the surface of the PLLA/1.2
GO sample became rough with a Ra value of 73.87
Degradation morphologies and mass loss of μm, a Rq value of 107.42μm, and a Rz value of
different proportions of PLLA/GO scaffolds are 899.90 μm and uneven, and the mass loss was
shown in Figure 3A-E. The surface of the PLLA close to 6%, indicating significant degradation and
sample did not change clearly after immersing in confirming that GO accelerated the degradation
PBS for 1, 2, and 3 weeks (Figure 3A). When the of PLLA (Figure 3E). Three-dimensional surface
immersing time was extended to 4 weeks, the surface morphologies of PLLA/GO samples with 0%,
of the sample became rough and surface roughness 0.3%, 0.6%, 0.9%, and 1.2% GO after degradation
of Ra, Rq, and Rz was 38.56 μm, 52.27 μm, and for 4 weeks are shown in Figure 3F-J. It can be
421.24 μm, respectively, and some precipitated clearly seen that the surface of PLLA/GO samples
particles appeared. Correspondingly, the mass after degradation became rougher as the GO
loss of samples was measured to quantitatively content increased (Figure 3K).
assess the degree of degradation. It could be seen
that PLLA had a small mass loss after 4 weeks of 3.4 Degradation mechanism
degradation and less than 1%. When 0.3% GO was It was proved by the degradation of morphology
introduced into PLLA, it could be seen that the and mass loss experiments that the introduction
surface of the PLLA/0.3 GO sample became rough of GO could accelerate the degradation of PLLA.
after 1 week of soaking (Figure 3B). After 4 weeks The explanation mechanism was also analyzed
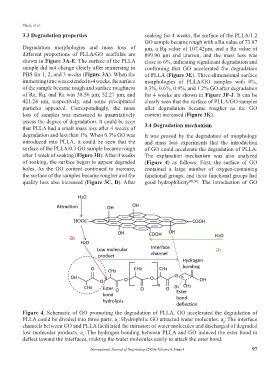
of soaking, the surface began to appear degraded (Figure 4) as follows: First, the surface of GO
holes. As the GO content continued to increase, contained a large number of oxygen-containing
the surface of the samples became rougher and the functional groups, and these functional groups had
quality loss also increased (Figure 3C, D). After good hydrophilicity [49,50] . The introduction of GO
Figure 4. Schematic of GO promoting the degradation of PLLA. GO accelerated the degradation of
PLLA could be divided into three parts. a : Hydrophilic GO attracted water molecules. a : The interface
2
1
channels between GO and PLLA facilitated the intrusion of water molecules and discharged of degraded
low molecular products. a : The hydrogen bonding between PLLA and GO induced the ester bond to
3
deflect toward the interfaces, making the water molecules easily to attack the ester bond.
International Journal of Bioprinting (2020)–Volume 6, Issue 1 97