
Page 104 - IJB-6-1
P. 104
Graphene oxide accelerates degradation of poly-l-lactic acid scaffold
A B
C D E
F G
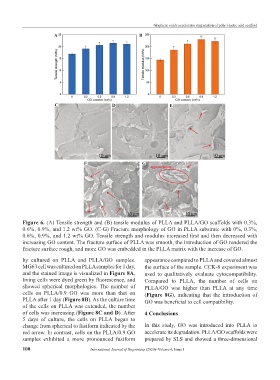
Figure 6. (A) Tensile strength and (B) tensile modulus of PLLA and PLLA/GO scaffolds with 0.3%,
0.6%, 0.9%, and 1.2 wt% GO. (C-G) Fracture morphology of GO in PLLA substrate with 0%, 0.3%,
0.6%, 0.9%, and 1.2 wt% GO. Tensile strength and modulus increased first and then decreased with
increasing GO content. The fracture surface of PLLA was smooth, the introduction of GO rendered the
fracture surface rough, and more GO was embedded in the PLLA matrix with the increase of GO.
by cultured on PLLA and PLLA/GO samples. appearance compared to PLLA and covered almost
MG63 cell was cultured on PLLA samples for 1 day, the surface of the sample. CCK-8 experiment was
and the stained image is visualized in Figure 8A, used to qualitatively evaluate cytocompatibility.
living cells were dyed green by fluorescence, and Compared to PLLA, the number of cells on
showed spherical morphologies. The number of PLLA/GO was higher than PLLA at any time
cells on PLLA/0.9 GO was more than that on (Figure 8G), indicating that the introduction of
PLLA after 1 day (Figure 8B). As the culture time GO was beneficial to cell compatibility.
of the cells on PLLA was extended, the number
of cells was increasing (Figure 8C and D). After 4 Conclusions
5 days of culture, the cells on PLLA began to
change from spherical to fusiform indicated by the In this study, GO was introduced into PLLA to
red arrow. In contrast, cells on the PLLA/0.9 GO accelerate its degradation. PLLA/GO scaffolds were
samples exhibited a more pronounced fusiform prepared by SLS and showed a three-dimensional
100 International Journal of Bioprinting (2020)–Volume 6, Issue 1