
Page 112 - IJB-6-1
P. 112
Matrix-assisted pulsed laser evaporation-deposited rapamycin thin films
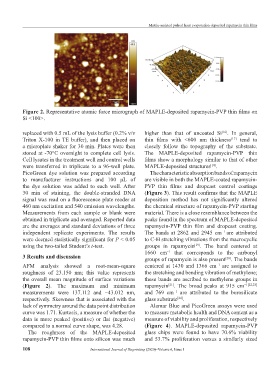
Figure 2. Representative atomic force micrograph of MAPLE-deposited rapamycin-PVP thin films on
Si <100>.
replaced with 0.5 mL of the lysis buffer (0.2% v/v higher than that of uncoated Si . In general,
[16]
Triton X-100 in TE buffer), and then placed on thin films with <600 nm thickness tend to
[17]
a microplate shaker for 30 min. Plates were then closely follow the topography of the substrate.
stored at -70°C overnight to complete cell lysis. The MAPLE-deposited rapamycin-PVP thin
Cell lysates in the treatment well and control wells films show a morphology similar to that of other
were transferred in triplicate to a 96-well plate. MAPLE-deposited structures .
[18]
PicoGreen dye solution was prepared according The characteristic absorption bands of rapamycin
to manufacturer instructions and 100 μL of are visible in both the MAPLE-coated rapamycin-
the dye solution was added to each well. After PVP thin films and dropcast control coatings
30 min of staining, the double-stranded DNA (Figure 3). This result confirms that the MAPLE
signal was read on a fluorescence plate reader at deposition method has not significantly altered
460 nm excitation and 540 emission wavelengths. the chemical structure of rapamycin-PVP starting
Measurements from each sample or blank were material. There is a close resemblance between the
obtained in triplicate and averaged. Reported data peaks found in the spectrum of MAPLE-deposited
are the averages and standard deviations of three rapamycin-PVP thin film and dropcast coating.
independent replicate experiments. The results The bands at 2862 and 2945 cm are attributed
−1
were deemed statistically significant for P < 0.05 to C-H stretching vibrations from the macrocyclic
using the two-tailed Student’s t-test. groups in rapamycin . The band centered at
[19]
1660 cm that corresponds to the carbonyl
−1
3 Results and discussion groups of rapamycin is also present . The bands
[20]
AFM analysis showed a root-mean-square centered at 1430 and 1366 cm are assigned to
−1
roughness of 23.150 nm; this value represents the stretching and bending vibration of methylene;
the overall mean magnitude of surface variations these bands are ascribed to methylene groups in
(Figure 2). The maximum and minimum rapamycin . The broad peaks at 915 cm −1[22,23]
[21]
measurements were 137.112 and −43.012 nm, and 769 cm are attributed to the borosilicate
−1
respectively. Skewness that is associated with the glass substrate .
[24]
lack of symmetry around the data point distribution Alamar Blue and PicoGreen assays were used
curve was 1.71. Kurtosis, a measure of whether the to measure metabolic health and DNA content as a
data is more peaked (positive) or flat (negative) measure of viability and proliferation, respectively
compared to a normal curve shape, was 4.28. (Figure 4). MAPLE-deposited rapamycin-PVP
The roughness of the MAPLE-deposited glass chips were found to have 70.6% viability
rapamycin-PVP thin films onto silicon was much and 53.7% proliferation versus a similarly sized
108 International Journal of Bioprinting (2020)–Volume 6, Issue 1