
Page 133 - IJB-10-6
P. 133
74
damage prediction by Chirianni et al. using the model (or Equation X) and the experimental
results reported by Han et al. (Scenario 1) and Li et al. (Scenario 2) for (B) printing with a given
75
73
nozzle diameter and various printing pressures, and (C) given printing pressure and various nozzle
diameter.
International Journal of Bioprinting Fluid mechanics of extrusion bioprinting
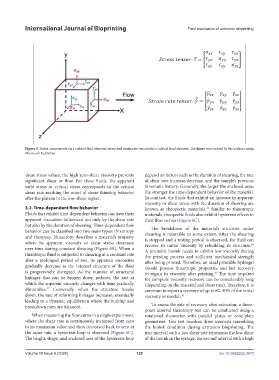
Figure 5. Stress components on a cubical fluid element; stress and strain rate tensors for a cubical
Figure 5. Stress components on a cubical fluid element; stress and strain rate tensors for a cubical fluid element. The figure was created by the authors using
Microsoft Publisher.
fluid element. The figure was created by the authors using Microsoft Publisher.
shear stress values, the high zero-shear viscosity prevents depend on factors such as the duration of shearing, the rate
significant shear or flow. For these fluids, the apparent of shear rate increase/decrease, and the sample’s previous
yield stress or critical stress corresponds to the critical kinematic history. Generally, the larger the enclosed area,
shear rate marking the onset of shear-thinning behavior the stronger the time-dependent behavior of the material.
after the plateau in the low-shear region. In contrast, the fluids that exhibit an increase in apparent
viscosity or shear stress with the duration of shearing are
3.2. Time-dependent flow behavior known as rheopectic materials. Similar to thixotropic
79
Fluids that exhibit time-dependent behavior can have their materials, rheopectic fluids also exhibit hysteresis effects in
apparent viscosities influenced not only by the shear rate their flow curves (Figure 6C).
but also by the duration of shearing. Time-dependent flow
behavior can be classified into two main types: thixotropy The breakdown of the material’s structure under
and rheopexy. Thixotropy describes a material’s property shearing is reversible to some extent. After the shearing
is stopped and a resting period is observed, the fluid can
where its apparent viscosity or shear stress decreases recover its initial viscosity by rebuilding its structure.
90
over time during constant shearing (Figure 6B). When a A printable bioink needs to exhibit low viscosity during
thixotropic fluid is subjected to shearing at a constant rate the printing process and sufficient mechanical strength
after a prolonged period of rest, its apparent viscosities after being printed. Therefore, an ideal printable hydrogel
gradually decrease as the internal structure of the fluid should possess thixotropic properties and fast recovery
is progressively disrupted. As the number of structural to regain its viscosity after printing. The time required
59
linkages that can be broken down reduces, the rate at for complete viscosity recovery can be considerably long
which the apparent viscosity changes with time gradually (depending on the material and shear rate). Therefore, it is
diminishes. Conversely, when the structure breaks common to report a recovery of up to 80–90% of the initial
77
down, the rate of reforming linkages increases, eventually 71 viscosity or moduli.
91
leading to a dynamic equilibrium where the buildup and
breakdown rates are balanced. To assess the rate of recovery after extrusion, a three-
point interval thixotropy test can be conducted using a
When measuring the flow curve in a single experiment, rotational rheometer with parallel plates or cone-plate
where the shear rate is continuously increased from zero geometries. This test involves three intervals resembling
to its maximum value and then decreased back to zero at the bioink condition during extrusion bioprinting. The
the same rate, a hysteresis loop is observed (Figure 6C). first interval with a low shear rate represents the low shear
The height, shape, and enclosed area of the hysteresis loop of the bioink in the syringe, the second interval with a high
Volume 10 Issue 6 (2024) 125 doi: 10.36922/ijb.3973