
Page 139 - IJB-7-3
P. 139
Rueda-Gensini, et al.
3.5. Improved electroconductivity of GO displays a much darker color (characteristic of rGO) in
reduced in situ comparison to the color immediately after printing. The
reduced weight loss profile of rGO when compared to
Several GO reduction methods have been reported that GO (~20% difference) observed with TGA experiments
yield high reduction efficiencies, usually by employing (Figure 6B) suggests that the improved thermal stability
high temperatures and by adding strong acids or bases at may be a result of a decrease in GO’s surface functional
high concentrations . However, these methods are not groups with our method. Similarly, FT-IR spectroscopy
[70]
compatible with our biofabrication scheme due to their analysis of GO and rGO sheets (Figure 6C) showed that
high cytotoxicity, especially considering that we need an carboxyl (1721 cm ) and hydroxyl (1364 cm ) peaks in
-1
-1
in situ reduction of GO to harness its bioactive effects rGO were strongly diminished, but epoxy peaks (1215 and
during the initial maturation stages of the bioprinted 1051 cm ) were conserved , suggesting a partial reduction
[72]
-1
constructs. As a result, we propose an alternative reduction was achieved. Moreover, Raman spectra of graphite, GO
scheme based on ascorbic acid exposure and incubation and rGO (Figure 6B) display the characteristic G and D
at 37°C, to maintain high levels of electroconductivity peaks, where G represents the degree of sp hybridization
2
without detrimentally affecting cell viability. Ascorbic and D represents structural disorder (increases with surface
acid concentration was selected according to previously modification) . When comparing GO to graphite spectra,
[73]
reported values that are non-cytotoxic for mesenchymal a clear increase in the D peak intensity is observed, which
stem cells . GO reduction was evaluated after 3 days indicates disruptions in the sp -hybridized structure as a
[71]
2
of exposure to ascorbic acid to subsequently assess the result of the presence of superficial carboxyl and hydroxyl
electroconductive potential of the bioinks. As observed groups. This, in turn, is an indicator of correct oxidation
in Figure 6A, after 3 days of incubation, the construct of the carbon structure, especially because the structural
A B C
D E
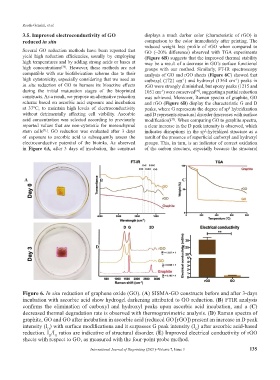
Figure 6. In situ reduction of graphene oxide (GO). (A) SISMA-GO constructs before and after 3-days
incubation with ascorbic acid show hydrogel darkening attributed to GO reduction. (B) FTIR analysis
confirms the elimination of carboxyl and hydroxyl peaks upon ascorbic acid incubation, and a (C)
decreased thermal degradation rate is observed with thermogravimetric analysis. (D) Raman spectra of
graphite, GO and GO after incubation in ascorbic acid (reduced GO [rGO]) present an increase in D peak
intensity (I ) with surface modifications and it surpasses G peak intensity (I ) after ascorbic acid-based
D
G
reduction. I /I ratios are indicative of structural disorder. (E) Improved electrical conductivity of rGO
G
D
sheets with respect to GO, as measured with the four-point probe method.
International Journal of Bioprinting (2021)–Volume 7, Issue 3 135